Parameters Step
The Parameters section contains the following tabs:
Parameters Tab
You can define additional parametersets beside Working and Reference. Iterations of the optimizer are automatically stored as separate parametersets. This allows to analyze the optimization progress and also go back to a previous set. See also Parametersets
The Parameters tab (see also Available Types of Parameters) contains the following elements:
List of all available parametersets, including the conversion parameterset that cannot be optimized.
Parameterset context menu (right-click)
Set as Working Parameterset: Sets selected parameterset as working parameterset.
Set as Reference Parameterset: Sets selected parameterset as reference parameterset.
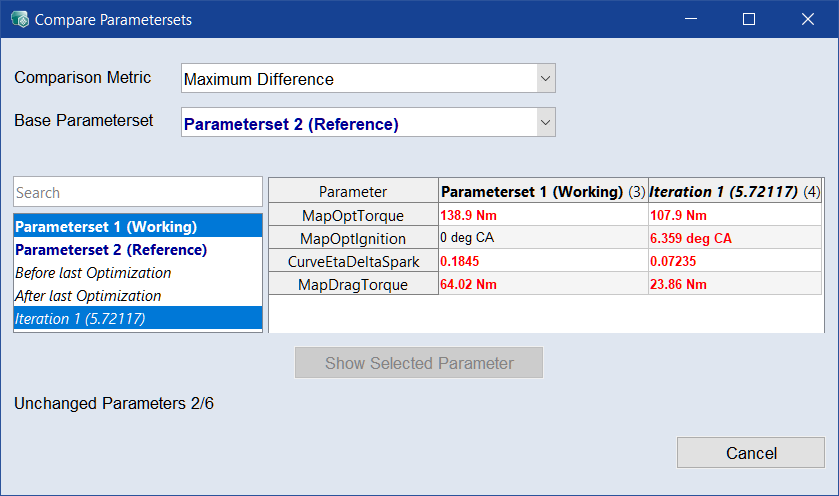
Compare selected Parametersets: Opens the  Compare Parametersets window. It shows the maximum difference per parameter and the number of changed and unchanged parameters.
Copy selected Parameterset to:
-
<Parameterset Name> (Working): Copies the parameters of the selected parametersets to the working parameterset.
-
<Parameterset Name> (Reference): Copies the parameters of the selected parametersets to the reference parameterset.
-
Conversion Parameters: Copies the parameters of the selected parametersets to the conversion parameters.
 Recalculate
If you click Recalculate directly, the RMSE is calculated for the selected parametersets.
The  button opens a drop-down menu.
Set as Working
Sets selected parameterset as working parameterset.
Set as Reference
Sets selected parameterset as reference parameterset.
Set as Conversion
Sets selected parameterset as conversion parameterset.
Duplicate
Creates a copy of selected parametersets and opens a naming dialogue.
New
Creates an empty parametersets and opens a naming dialogue.
Delete
Deletes selected parametersets and containing values.
Rename
Opens a dialog window to rename selected parametersets.
See also Parametersets.
If you click Import directly, the parameters and their values are imported from a file.
The button opens a drop-down menu.
Export
Click Export to open the Export Parameters window, where you can specify the location, name, and file type for the parameters to be exported.
To select only certain parameters for export, use the checkboxes in the Export column of the Parameters table.
The button opens a drop-down menu.
|
Parameters (default) |
Opens an open file dialog, where you can specify the location, name, and file type for the parameters to be exported. |
|
Bounds |
Exports the bounds of map, curve and cube-3D/cube-4D parameters to a file. |
|
Parameters and Bounds |
Exports all parameters, their values and bounds (only map, curve and cube-3D/cube-4D parameters) to a file. |
|
Patch Parameter or Variant in Existing DCM File |
Exports the selected parameters or variants and patches them into an existing DCM file. This way only the changed parameters can be exported and added to the existing file. |
|
Selected Parameters to Bosch iLrn (offline) |
Exports the selected parameters, curves, maps and cubes as BIN and DCM file as iLrn (offline) flatbuffer for Bosch ECUs. |
|
Compressed Model to M-script |
Exports parameters of type Compressed Model to an M script file so that the model can be executed in MATLAB®. |
|
Compressed Model to Bosch AMU |
Exports parameters of type Compressed Model to a DCM/CDFX file for Bosch AMU. |
|
Parameter list as LAB |
Exports parameter names to a LAB file for easy selection in ETAS INCA. |
|
Note |
|---|
|
Available export formats are DCM Files (*.dcm), several comma-separated value formats (*.csv), several Excel formats (*.xls, *.xlsx,*.xlsm), calibration data files (*.cdfx), M-scripts (*.m), and LAB files (*.lab). |
See also Exporting Parameters and/or Bounds.
Create
Opens the Create Parameter window where you can create a new parameter. See also Create a Parameter.
Edit
Opens the "Edit Parameter" window where you can edit the selected parameter.
Duplicate
Creates a copy of the selected parameter and names it <parameter>(<n>). Selecting two or more parameters is possible.
Delete
If you click directly on Delete, selected parameter(s) is removed from current selected Parameterset.
The button opens a drop-down menu.
(Un)Lock Points
Click Lock Points to exclude the selected grid points from optimization.
The button opens a drop-down menu.
|
Note |
|---|
|
Single grid points with or without data can be locked or unlocked via context menu (right-click). |
 Menu button
Opens a drop-down menu.
Parameters table
Lists all parameters in the project.
Use F2 or Double-click a cell to edit the value.
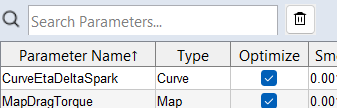
Use the search bar to search for a parameter name. Use  to clear the search.
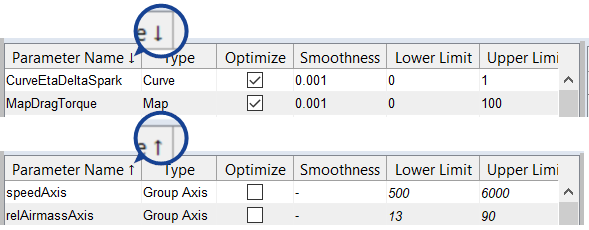
The table can be sorted in ascending or descending order using the table header. Clicking the table header will sort the table by the corresponding column.
You can use the standard Ctrl/Shift selection functions in the table
Right-click in the table to open the context menu of the selected parameters.
In addition to the parameter names and types, the table contains the following columns.
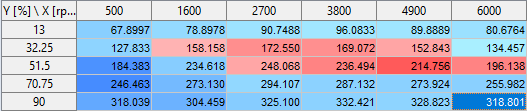
Shows the values of the selected parameter. For curves/maps/cubes, the axes are displayed as the column/row headers of the table. The first axis (x) is displayed as the column header. The second axis (y) is displayed as the row header. The cells display the parameter values.
The appearance of the table depends on the parameter type. For 3D and 4D cube parameters, the third and fourth axes are displayed as separate lists. For parameters of compressed model types, the inputs are displayed in a separate list.
Use F2 or Double-click a cell to edit the value.
You can use the standard Ctrl/Shift selection functions in the table
Differences between the reference and working parametersets are visually distinguished in the table using different shades of red and blue. Cells appear redder when the reference value is lower and bluer when it is higher, with the darkness of the color reflecting the extent of the difference.
Use the Difference Heatmap checkbox in the Show area to activate/deactivate the color coding.
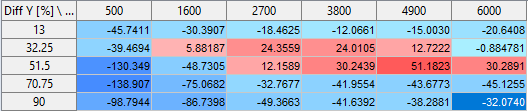
When the Reference option of the Show area is activated, the table shows the differences between the reference and working parametersets.
To open the context menu of the selected parameter value, right-click in the selection.
Plot area
Shows a plot of the selected parameter. The look of the plot depends on the parameter type.
|
Note |
|---|
|
Parameters of matrix type cannot be plotted. |
For scalars, curves, maps, and cubes, the plot area contains the following elements:
Parameter Window
|
Note |
|---|
|
Only available for curve and map parameters. |
Opens the Parameter window, where you can edit the bounds.
Show
Select whether a parameter plot or a heatmap should be displayed.
The following options are only available for parameter plots:
Activate the corresponding checkbox to show:
- the parameter from the working parameterset (Calibration)
-
the reference/initial parameterset (Reference, see also Dealing with Reference Parameters)
-
When activated, the Parameter value table shows the differences between the reference and working parameter.
-
-
the upper and lower bounds (Bounds, only available for curve and map parameters)
-
the color-coded differences in the parameter value table (Difference Heatmap)
-
the data points as black dots in the plot. Select the data to display from the drop-down list (Data).
The signals of the project and a special signal Parameter Output are available. Parameter Output shows the input signals evaluated by the parameter. This is useful to see the distribution of the input signals.
2D View
Activate the checkbox to display the parameter plot as a 2D plot. Use the drop-down menu to select whether to display the X-Z or the Y-Z axes as the X and Y axes of the 2D plot.
The third axis data can be displayed as connected points in the 2D plot. Therefore select the corresponding row or column in the parameter value table above. Select multiple values (Ctrl or Shift)in the table to display multiple values in the plot.
System Constants Tab
The System Constants tab (see also System Constants) contains the following elements:
System Constants
Lists the existing system constants.
Name: Use the input field to create a new system constant. See also Creating and Editing a System Constant.
Use Default: If you activate the checkbox, the default values defined for the parameters in the corresponding system constant are used.
Delete System Constant
Deletes the currently selected system constant.
Constant Values for <system constant>
|
Note |
|---|
|
Only visible when a system constant is selected. |
Lists the content of the selected system constant.
Parameter: Lists the parameters in the currently selected system constant. Use the drop-down list to add another parameter to the system constant. See, Creating and Editing a System Constant.
Constant Value: Type a value in the input field to use it instead of the original parameter value for the system constant.
Delete Parameter
Deletes the selected parameters from the system constant.
See also
Step 3: Parameters (tutorial)