Available Types of Parameters
This chapter provides a brief overview of the various types of parameters that can be used in the function (see Step 5: Build Up the Function) for optimization (see Step 6: Optimization).
The parameters are divided in to the following classes:
- Maps
- Curves
- Scalar
- 3D- and 4D-Cubes
- Compressed Model
- Matrix
- Group Axis
- Text Scalar/Matrix/Curve/Group Axis
Scalar, Cube-3D and Cube-4D parameters are similar to curves and maps, except that they have no, three (X, Y, Z1), or four (X, Y, Z1, Z2) axes. See
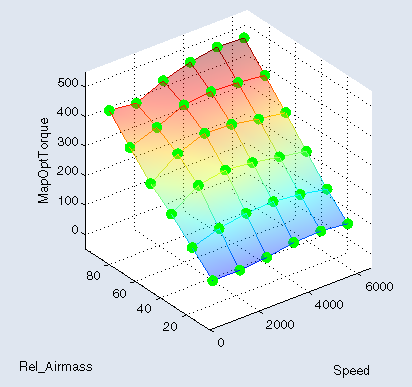
Maps
A map is represented by a set of Z values that are defined over a two-dimensional grid that represents the X and Y axes.
In between grid points, the corresponding Z values are calculated by bi-linear interpolation. Therefore, the functional dependency is given by z = z(x, y) and a map is stored in the form of a two-dimensional lookup table.
Outside the grid, either clip- or linear interpolation is applied.
You can set up input-dependent bounds for map parameters. These can be edited in the
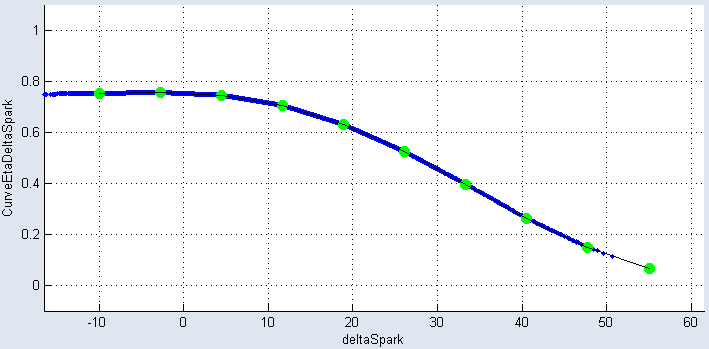
Curves
A curve is represented by a set of Y values that are defined over a one dimensional grid, that represents the X axis.
In between grid points, the corresponding Y values are calculated by linear interpolation. Therefore, the functional dependency is given by y = y(x) and a curve is stored in the form of a one-dimensional lookup table.
Outside the grid, either clip- or linear interpolation is applied (cf. figure below).
You can set up input-dependent bounds for curve parameters. These can be edited in the
Scalar
A scalar is a 0-dimensional calibration parameter.
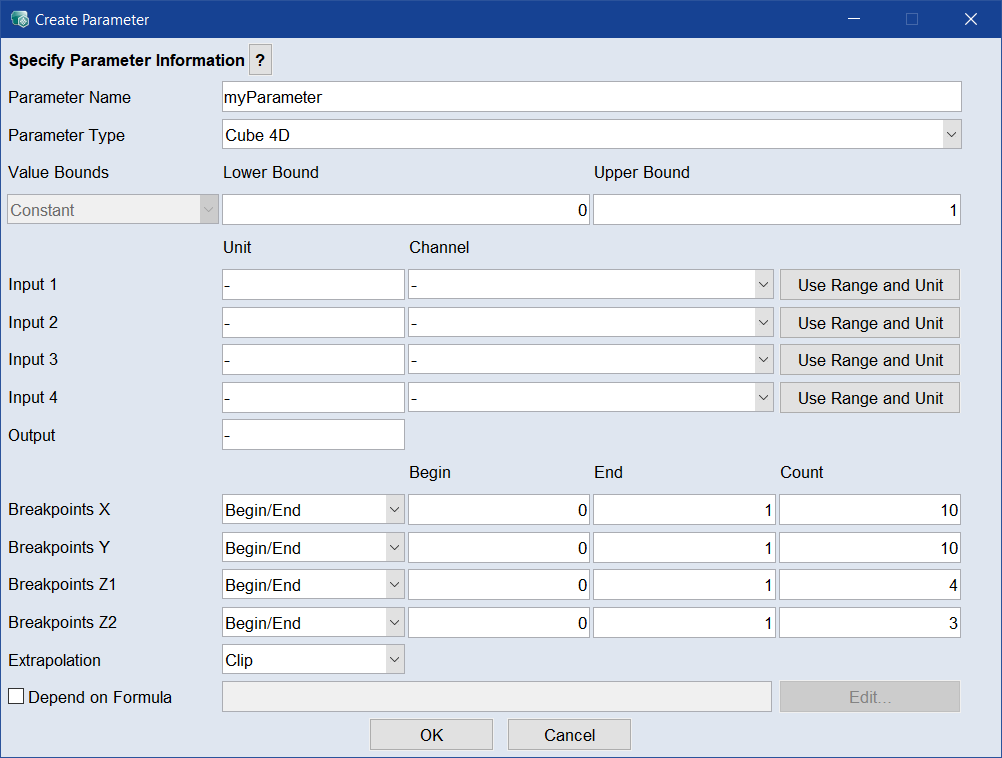
3D- and 4D-Cubes
In addition to curves (one input) and maps (two inputs), ASCMO-MOCA supports also lookup tables with three and four inputs: Cube-3D and Cube-4D.
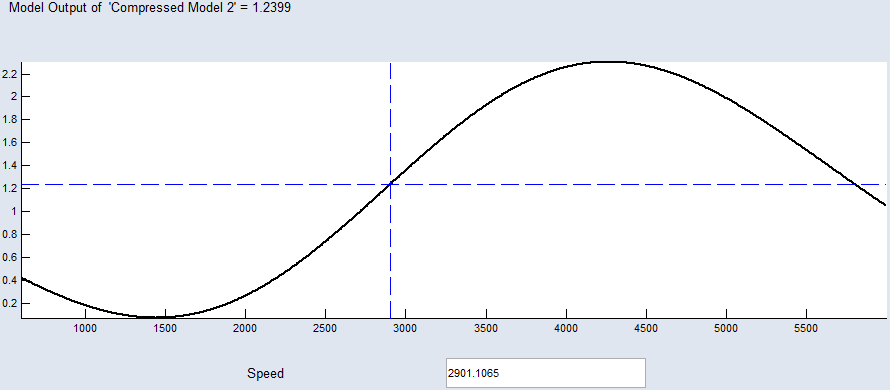
Compressed Model
In addition to lookup tables (Curve, Map, Cube), ASCMO-MOCA also supports networks of radial basis functions with a squared exponential kernel (RBF Net-SE) as a parameter.
The number of inputs for such a parameter can be chosen by the user. Also the number of basis functions (kernels) must be chosen by the user. A higher number of inputs and kernels increases the computational complexity of the optimization and evaluation of such a parameter.
The evaluation function for the parameter is a superposition of Gaussian functions. A rough estimate of the computational complexity for the function is "Number of inputs" multiplied with "Number of basis functions" evaluations of the e-function.
It can be seen as a black-box data based model and is also available in ASCMO as "Compressed Model". It can replace a whole function consisting of multiple lookup tables and connections between them.
A higher number of kernels increases the fidelity of the model, but it can result in overfitting and should be tested with test data.
Matrix
ASCMO-MOCA supports matrix parameters. A matrix is a two-dimensional, indexed set of elements. The position of a scalar value within a matrix is determined by its associated index values (non-negative integer values).
Group Axis
ASCMO-MOCA supports group axes for shared axes, which are used by several parameters, e.g. multiple maps share the same axes. They are handled as a separate parameter type. Using group axes ensures, they are consistent. Group axes are especially useful for Simulink® or FMU parameter mappings. For example if Simulink® multiple variable mappings point to the same variable in a Simulink® model or calculated parameters point to the same value reference in an FMU model. Group axes can be exported and imported as DCM or CDFX file and are automatically detected and created using the scan or validate function in the Models Step.
Group axes cannot be used in a function. Group axes can be optimized. Using group axes speeds up the communication with external models.
Text Scalar/Matrix/Curve/Group Axis
|
Note |
|---|
|
Text parameters can only be imported using a DCM and an A2L file; they cannot be created or edited. To import them, click Import, select the DCM file, and click Open. Then, click Load A2L File to select the corresponding A2L file. |
Text Scalar: For text scalars, you can select the corresponding label in the Enumeration column drop-down. This label consists of the text part and its corresponding actual value in the control unit.
Text Matrix: Text matrices are similar to text scalars, but they have multiple cells with drop-downs where you can select the corresponding labels. These labels consist of the text and their respective actual values in the control unit.
Text Curve: For text curves, the Label column represents the X-axis and contains both the text part and its corresponding actual value in the control unit. In the Value column, you can find the corresponding Y-values. To edit a value, double-click the respective cell.
Text Group Axis: This is a group axis for multiple curves, where the X-axis is displayed as text in the Label column. The corresponding actual value in the control unit is shown in the Index column. The # column represents a continuous count.
See also