Parameter <parameter_name>
Parameters / Optimization step > Parameter Window
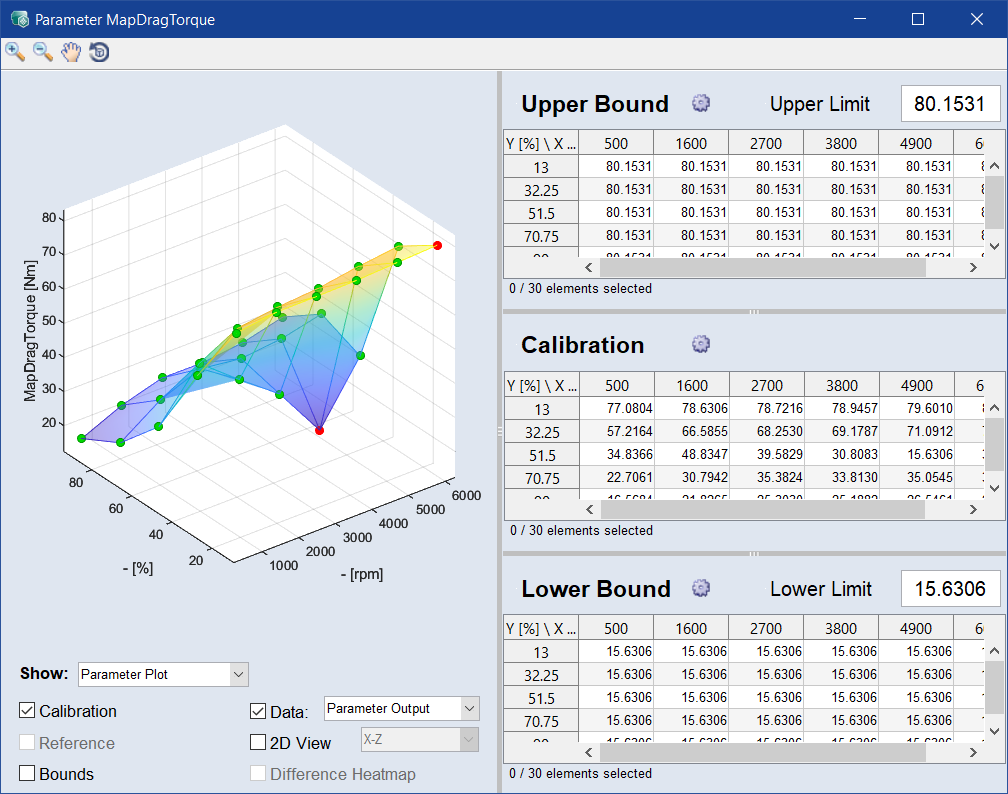
For a curve or map parameter, the Parameter<parameter_name> window can be used to specify global optimization bounds, optimization bounds per grid node, and parameter values. For a 3D or 4D cube parameter, the window can be used to specify global optimization bounds and parameter values.
The Parameter<parameter_name> window contains the following elements:
Toolbar

|
Zoom In | Clicking in the plot will enlarge the plot representation. |

|
Zoom Out | Clicking in the plot will reduce the plot representation. |

|
Pan | Thus, the plot can be shifted within the window. |

|
Rotate 3D | Thus the 3D plot can be rotated in all three spatial directions. |
Plot
Here, the curve or map (![]() )and its bounds (
)and its bounds (![]() ) are displayed. You can drag the grid points to change their values.
) are displayed. You can drag the grid points to change their values.
Show
Select whether a parameter plot or a heatmap should be displayed.
The following options are only available for parameter plots:
Activate the corresponding checkbox to show:
- the parameter from the working parameterset (Calibration)
-
the reference/initial parameterset (Reference, see also Dealing with Reference Parameters)
-
When activated, the Parameter value table shows the differences between the reference and working parameter.
-
-
the upper and lower bounds (Bounds, only available for curve and map parameters)
-
the color-coded differences in the parameter value table (Difference Heatmap)
-
the data points as black dots in the plot. Select the data to display from the drop-down list (Data).
The signals of the project and a special signal Parameter Output are available. Parameter Output shows the input signals evaluated by the parameter. This is useful to see the distribution of the input signals.
2D View
Activate the checkbox to display the parameter plot as a 2D plot. Use the drop-down menu to select whether to display the X-Z or the Y-Z axes as the X and Y axes of the 2D plot.
Upper Bound
The table contains the upper bound values at the grid points of the curve or map. You can edit the points by double-clicking on the cell.
Use the gear  button to edit the breakpoints of the upper bound. See, Edit Breakpoints of Bounds.
Type a value in the Upper Limit input field to set as upper bound.
Calibration
If Reference is deactivated, the table shows the parameter values at the grid points of the map, curve, or cube. If Reference is activated, the table shows the difference values at the grid points of the map, curve, or cube.
You can edit the values of the calibrated map/curve/cube.
Lower Bound
The table contains the lower bound values at the grid points of the curve or map. You can edit the points by double-clicking on the cell.
Use the gear button to edit the breakpoints of the lower bound. See, Edit Breakpoints of Bounds.
Type a value in the Lower Limit input field to set as lower bound.
See also