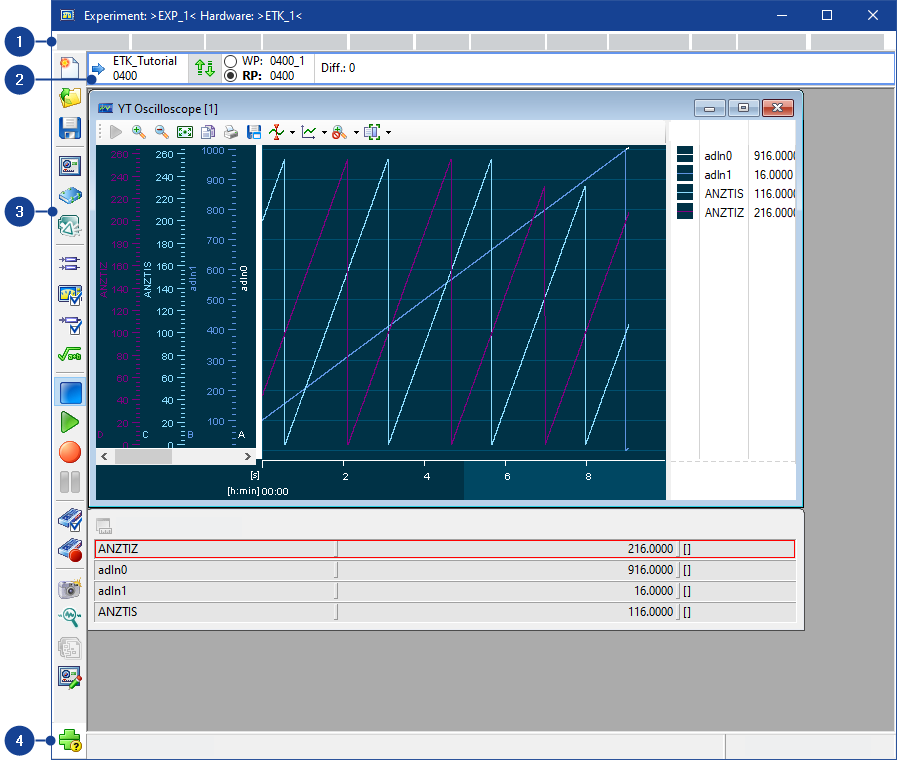
Experiment: exp Hardware: hw Window
In the Experiment: exp Hardware: hw window, you can create further windows in which you can view and edit variables.
The window title bar shows the open experiment and the workspace being used.
The Experiment Environment window consists of the following components:
This menu contains the following functions:
New
Closes the current experiment and creates a new, empty experiment.
If you changed any settings in the previous experiment, a message box is displayed. You can specify whether or not you want to save your changes.
Open
Opens the Load Dialog box in which you can select an experiment you want to open.
If you changed any settings in the previous experiment, a message box is displayed. You can specify whether or not you want to save your changes.
Save
Saves the current settings in the experiment environment.
Save As
Opens the Save as dialog box, in which you can specify an experiment for saving the current settings in the experiment environment or create a new experiment.
Load VUI Window
Opens a dialog box in which you can select a file containing a variable user interface you want to open (file extension .vui).
Hardware Configuration
Opens the Hardware: hw Experiment: exp window in which you can configure hardware. If the window is already open, it is placed in the foreground.
The Experiment: exp Hardware: hw window remains open.
Go to INCA Main Window
Changes to the INCA Database Manager.
The Experiment: exp Hardware: hw window remains open.
Protocol of Configuration
Opens a browser in which you can display the configuration protocol.
The configuration protocol documents all variables in the experiment environment with their settings and parameters.
Note |
The configuration protocol of the experiment environment can also contain the configuration protocol of the hardware configuration editor. |
Close
Closes the experiment environment.
If you have changed any settings in the experiment, a message box is displayed. You can specify whether or not you want to save your changes.
This menu contains the following functions:
Toolbar
Shows or hides the toolbar.
Status Bar
Shows or hides the status bar.
The availability of functions in the Edit menu depends on the window type of the active window.
This menu contains the following functions:
Undo: Last value change
Undoes the last change of a value in an editor. If you want to undo more than one value, you can reset them step by step by selecting the menu command multiple times.
Redo: Last value change
Restores the previous change. If you want to restore more than one value, you can restore it step by step by selecting the menu command multiple times.
Decrement
Decrements the data by a default value.
Increment
Increments the data by a default value.
Add offset
Increases or decreases the data by a certain value.
Multiply by Factor
Multiplies the data by a certain value.
Divide by a Divisor
Divides the data by a certain value.
Fill with Values
Replaces the data by a certain value.
Reset to Reference Page Value
Resets the value on the Working Page to its reference page value.
Complete Map | Resets the values in all fields to their reference page values. |
Selected Area | Resets the values in the marked fields to their reference page values. |
X-Axis
The menu options in the sub-menus allow operations on axis points of the x-axis.
Y-Axis
The menu options in the sub-menus allow operations on axis points of the y-axis.
Z-Axis
The menu options in the sub-menus allow operations on axis points of the z-axis.
Interpolate in X-Direction
Interpolates the value in the direction of the X-axis.
Interpolate in Y-Direction
Interpolates the value in the direction of the Y-axis.
Copy
Copies the selected variable values to the clipboard.
Paste
Inserts the values from the clipboard.
Copy all data to clipboard
Saves the values of the curve or map to the clipboard.
Select All Values
All data of the curve or the map is selected.
The following menu function are only available if the add-on module INCA-QM-BASIC was installed:
Edit Previous Status Entry
Opens a dialog box in which you can edit the previous status entry.
Create New Status Entry
Opens a dialog box in which you can create a new status entry.
Display status history
Opens a dialog box in which your status history is displayed.
Undo: Last scaling
Undoes the last scaling of an oscilloscope.
Redo: Last scaling
Restores the previous scaling.
Copy Properties
Copies the data settings to the clipboard.
Paste Properties
Inserts the data settings from the clipboard.
Select All
Selects all channels in a measure window.
This menu contains the following functions:
Variable Selection
Opens the Select variables window, where you can select the variables you will use in the experiment.
Display Configuration
Opens the Display Configuration in which you can configure the display of the elements used in the experiment.
Variable Configuration
Opens the Variable Configuration in which you can configure the recording status of the variables used in the experiment.
Find Variable
Opens the Search for variable dialog box, in which you can enter the name of the variable you want to search for. You are shown all levels and editors in which the variable occurs.
Variable Name Display Setup
Opens the Variable Name Display Setup dialog box, in which you can specify how the variables are to be displayed in the Experimentation Environment.
About Variable
Displays information about the selected variable.
Variable Documentation
Opens ECU documentation, jumping directly to the documentation of the selected variable.
Copy Variable to Window
Copies the selected variables to another window.
Move Variable to Window
Moves the selected variables to another window.
Save used variables (LAB format)
Opens a dialog box where you can specify the file to which INCA will save all variable names selected in the experiment environment.
The file is saved in LAB format (ASCII file format) and can be used in other INCA modules - for example, in the Calibration Data Manager.
VUI Variable Configuration
Manages the assignment of variables in the experiment environment to elements in the current variable user interface.
Save | Opens a dialog box where you can specify a file for saving the assignment. |
Load | Opens a dialog box where you can select a file from which INCA loads an assignment. |
Display HEX Editor
Opens the HEX Editor, where you can display, compare and edit datasets and memory pages in the ECU:
Working Data | Opens the working dataset and the ECU working page in the HEX editor. |
Reference Data | Opens the reference dataset and the ECU reference page in the HEX editor. |
Code | Opens the code page of the INCA database and of the ECU in the HEX editor. |
DPR | Opens the DPR of the ETK in the HEX editor. |
Configure Output Channels
Opens a window where you can select measure variables that you would like to transfer to the output channels of a connected device, for example an ES930 Multi-I/O-module, as an input variable.
Note |
Following three entries are available only if the INCA-MCE add-on is installed. |
MCE - Select Variables for MCE
Opens a window where you can select variables to add to the MCE configuration.
MCE - Add All Calibration Variables of Experiment
If activated: Calibration variables of the experiment will be added to the MCE configuration automatically when calibration access gets enabled.
MCE - Add All Measures Variables of Experiment
If activated: Measurement variables of the experiment will be added to the MCE configuration automatically when measurement starts.
Note |
Current settings (activated / inactivated) of above two entries are not saved with EE. When EE opens, their initial settings are copied from respective INCA user options in MCE tab. |
Define/Manage Calculated Signals
Opens the Manage Calculated Signals dialog box, in which you can create and manage new mathematically linked measure variables from existing measure variables.
You can define calculated signals for all devices that return a raster-related measure signal.
New Calibration Scenario Configuration
Creates a new empty calibration scenario configuration and opens it in the Calibration Scenario Editor.
Open Calibration Scenario Configuration
Lets you select a calibration scenario configuration and opens it in the Calibration Scenario Editor.
Close Calibration Scenario Configuration
Closes the Calibration Scenario Editor.
Adaptive Characteristics
Contains menu functions for editing adaptive characteristics:
Write to PaCo File | Opens a dialog box in which you can select the adaptive parameters whose values you want to save in a PaCo file. |
Write to CDF File | Opens a dialog box in which you can select the adaptive parameters whose values you want to save in a CDF file. |
Write to CVX File | Opens a dialog box in which you can select the adaptive parameters whose values you want to save in a CVX file. |
Write to DCM File | Opens a dialog box in which you can select the adaptive parameters whose values you want to save in a DCM file. |
Read Adapt. Characteristics from File | Opens a dialog box in which you can select a file from which you want to read the adaptive parameters. |
InCircuit2
Contains menu functions for preparing the control device for the online application of calibration variables:
Note |
This menu function is available only if the add-on module MCS-InCircuit2 was also installed with INCA. |
Experiment Preparation | Opens the Experiment preparation dialog box, in which you can select the calibration variables to be applied online in the control device. |
Show ARAM contents | Opens a window displaying the currently selected online applicable calibration variables and their memory addresses in the control device RAM. |
Limited Emulation RAM
Contains menu functions for preparing control devices with limited emulation RAM for the application:
Reconfigure | Opens the Reconfigure dialog box, in which you can select the calibration variables and their memory areas.
| ||
Automatic Reconfigure | If the user option Operation mode is set to Experiment preparation: If the user option Operation mode is set to Dynamic emulation:
| ||
Show Configuration | Opens a window displaying the memory areas that can currently be calibrated. |
For detailed information see the PDF document Serial (X)ETK Calibration Concepts — Limited Emulation RAM, which you can find in the Manuals folder of your INCA installation.
Contains menu functions for control devices using the single pointered method via XCP protocoll:
Automatic Reconfigure | INCA does not automatically clear the PoolRam. If the PoolRAM is used up, you can reconfigure it for the connected hardware device automatically. | ||||||
Show Configuration | Displays the PoolRAM configuration. In the monitor window, the
The configuration is only shown if the A2l file of the experiment supports the single pointer calibration method and the connected devices are in online mode. |
This menu contains the following functions:
Stop Measuring
Stops the current measurement. Both the display and the recording of measure data are stopped.
When you stop recording, the Recording information for: <file> dialog box opens, where you can save the recorded data.
Start Visualization
Starts displaying measure data continuously.
Note |
Measure data visualization is only possible in online mode. If you opened the experiment in offline mode, with the setting Experiment without full HW access, you have to initialize the hardware explicitly before you can start visualizing measure data. |
Start Recording
Starts recording and displaying measure data.
Note |
Measure data recording is only possible in online mode. If you opened the experiment in offline mode with the setting Experiment without full HW access, you have to initialize the hardware explicitly before you can start recording measure data. |
Pause Recording
Stops recording of measure data. INCA continues to display measure data.
The Insert pause comment dialog box opens where you can enter a reason for the pause.
Manual Trigger
Activates the manual trigger to start recording measure data (if you have defined a manual trigger).
Freeze Visualization
Stops or resumes display of measure data during measurement. The recording of the measure data continues even when the display is stopped.
Set Marker
Opens the Insert User Comment dialog box where you can enter text for the marker. INCA continues to display and record measure data in the background.
The marker is inserted in the recording file at the place where you called the function. You can view it during measure data analysis.
Open Recorder Configuration
Opens the Recorder Configuration dialog box where you can make settings for recording measure data, see Configuring a Recorder.
Open Recorder Manager
Opens the Recorder Manager, see Overview of Recorder Manager.
Fast Start
Contains menu functions for making cold-start and fast-start measurements.
Note |
This menu function is available only if the add-on module MCS-CalibrationAcquisitionExt is installed with INCA. |
Store Measurement Configuration in ECU | Writes the current variable configuration to the RAM of the ETK (application with parallel ETK) or the control device (application with serial ETK). |
Delete Measurement Configuration in ECU | Deletes the variable configuration stored for fast start measurement in the RAM of the ETK (application with parallel ETK) or the control device (application with serial ETK). |
This menu contains the following functions:
ECU Calibration Access
Enables or prevents calibration access to the ECU.
This function must be enabled if you want to change calibration values in the ECU. A calibration privilege is not required for pure measurements.
 Initialize Hardware
Initializes all hardware added to the current workspace.
The ECU has to be reset before initialization. If the ECU is running, switch off the ignition.
If the memory pages of the control device are not updated, the Memory pages device window opens.
 Initializes Unconnected Devices
Initializes devices that are not yet connected.
 Hardware Mapping
Opens the Hardware Mapping dialog box, in which you can map hardware to hardware representations created in INCA.
 Hardware Status
Opens the Hardware status window and displays the current status of all devices.
If the hardware is not yet initialized, it is initialized now.
 Manage Memory Pages
Opens the Memory pages device window where you can view, compare and change the INCA datasets and memory pages in the ECU.
Switch Between Working/Reference Page
Toggles between displaying the values of the working page and the reference page.
Active Device Group
Specifies whether group calibration is activated or deactivated.
The group remains as a group even after you deactivate group calibration.
Send Cyclic Commands
Activates or deactivates the sending of cyclic XCP commands. If you deactivate the sending of cyclic commands for a device, cyclic commands for connection status and time synchronization are suppressed. The ECU goes into sleep mode without being interrupted by cyclic requests. You can still measure and calibrate, but the commands interrupt the sleep mode. In addition, COM API is supported.
ü<device> | Sending of cyclic commands for selected device is activated. |
<device> | Sending of cyclic commands for selected device is deactivated. |
Resume All | Sending of cyclic commands for all devices is resumed. |
Suppress All | Sending of cyclic commands for all devices is suppressed. |
Manage Store Bits
Note |
You can make these settings only if the application is run via a CCP interface that supports the respective functionality. |
Requests the control device to copy the working dataset to the reference dataset. The procedure usually takes places later (during the shutdown logic).
Check Firmware Status
Checks the firmware status of the connected hardware which is used by INCA.
Note |
Checking the firmware status with INCA requires HSP
V7.1.0 or later. Checking the firmware is possible only for hardware that is completely supported by HSP. |
Update Firmware
Opens the HSP Update Tool and checks whether the firmware of the connected ETAS hardware, which is referenced in the INCA hardware configuration, is compatible with the current INCA version. If the firmware needs to be updated, you can start the firmware update directly from within the HSP Update Tool.
Note |
This function requires HSP V7.1.0 or later. Checking the firmware status is possible only for hardware that is completely supported by HSP. |
Exports your experiment configuration for DAQ based measurement configurations. Use the export function to configure your measurement data source or to interpret trace data.
The export contains:
Measure Configuration as JSON
XCP session properties as JSON
A2L file(s)
The following graphic shows an example use case for a zipped export: 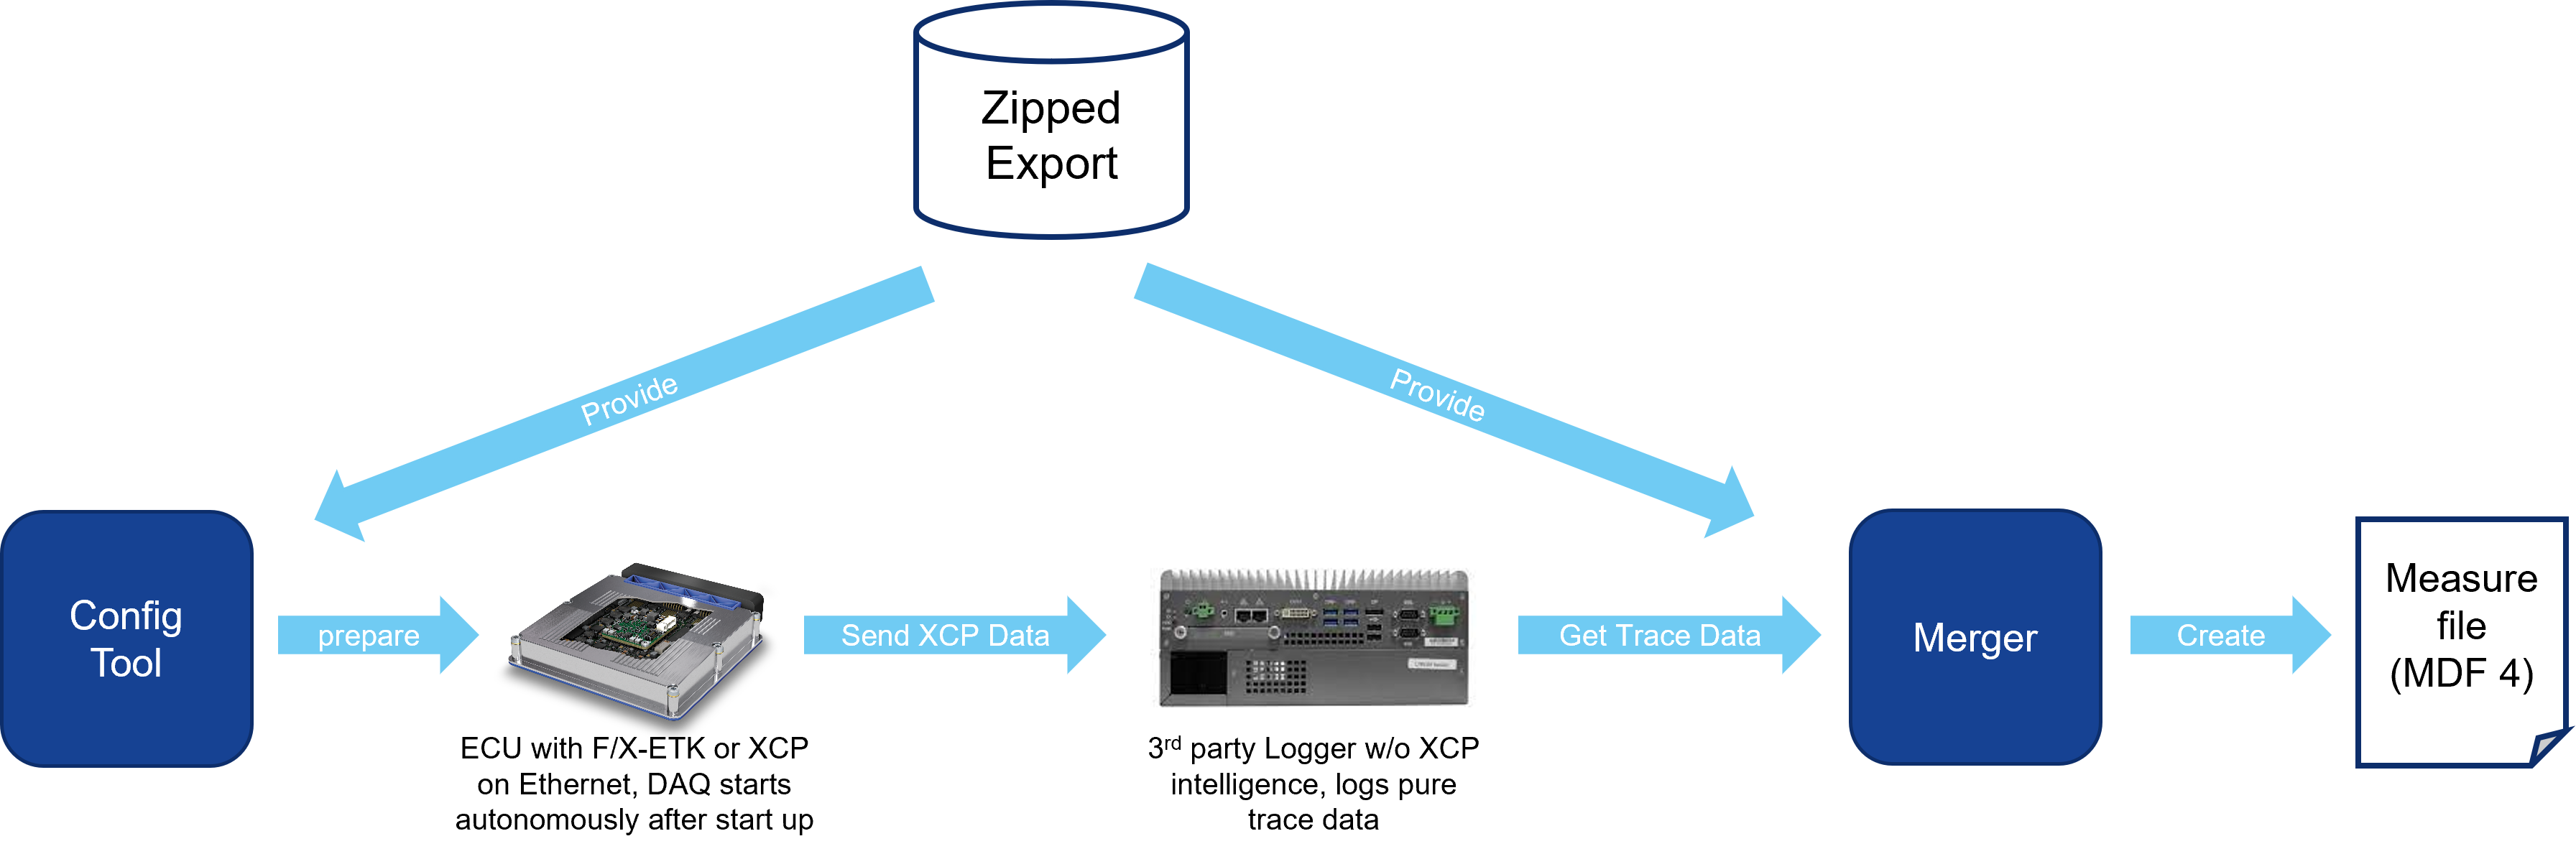
Drive Recorder
Note |
Drive Recorder is only available if the ETAS Drive Recorder add-on is installed. |
This menu function provides three options to interact with the Drive Recorder:
Optimized Export... | Exports INCA configurations with reduced A2l file for the ETAS Drive Recorder. |
Export... | Exports INCA configurations for the ETAS Drive Recorder. |
Open Drive Recorder Configurator | Opens the ETAS Drive Recorder Configurator. |
This menu contains the following functions:
Change Working Data
Opens the Select working data for device dialog box where you can select a new working dataset.
If you select a reference dataset, INCA creates a copy of it and makes the copy the new working dataset.
Freeze Working Data
Opens the Freeze working data for device dialog box where you can specify the name for the new reference dataset.
INCA freezes the working dataset and makes it the new reference dataset. INCA then creates a new working dataset.
Save Working Data As
Opens the Save working data for device dialog box where you can specify the name for the new working dataset.
You can specify a new name or overwrite an existing dataset.
Enterprise CDM
These menu functions provide direct access to any enterprise calibration data management system from within INCA.
These menu functions are only available if the eCDM add-on is installed.
Connect to Enterprise CDM Adapter | Establishes a connection to the Enterprise CDM system.
| ||
Get ECU Projects | INCA loads a project description file (*.A2L), a HEX file (optional), and a CDF V2.0 file for quality meta data (optional) from the Enterprise CDM system. INCA adds the project as a new project and creates datasets from the HEX and CDF V2.0 files.
| ||
Send ECU Project | INCA transmits the project description file (*.A2L) and the HEX file from INCA into the Enterprise CDM system. In addition to that, INCA sends a CDF V2.0 file containing all calibration variables of the project as well as the corresponding meta quality data, if available.
| ||
Get Datasets | INCA loads HEX files (and optionally CDF V2.0 files for quality meta data) from the Enterprise CDM system and adds them as new datasets. The files must match the selected project.
| ||
Send Datasets | INCA transmits the selected HEX files from INCA to the Enterprise CDM system. | ||
Update from Data Exchange File | INCA loads one or more data exchange files from the Enterprise CDM system in order to copy the contents over the selected dataset. For that purpose, INCA opens the Variable Selection dialog, where you can select the variables to be copied. This function can only be executed if the Working Page is activated. | ||
Get Data Exchange File | INCA loads data exchange files (CDF V2.0) from the Enterprise CDM system. The files must match the selected project.
| ||
Send Data Exchange File | INCA generates a CDF V2.0 file containing all calibration variables used in the experiment, as well as the corresponding meta quality data, if available. It thereby refers to the values of the selected page (WP or RP). The name of CDF V2.0 file corresponds to the name of the original HEX file, plus a suffix if the name already exists. The CDF V2.0 file is then transmitted to the Enterprise CDM system. | ||
About | Provides information on the plug-in which is installed for connecting your Enterprise CDM system to INCA (class name, DLL name). |
Calibration Log
If you want to log calibration activities, you have to make sure that logging of the value history is activated in the user options (menu option Data handling on the Calibration Log tab).
Enables documenting of calibration activities.
Write | Logs the calibration activities of the selected device to a file (file name extension .log). |
Add Comment | Opens a dialog box in which you can write comments on the calibration activities. |
Write All | Logs the calibration activities of all editors of the experiment to a file (file name extension .log). |
Display Status History
Note |
This menu function is available only if the plug-in module QM-BASIC is installed together with INCA. |
Opens the Status history for dataset window in which you can show and edit the status history of the current dataset.
Variables
Read Calibrations from File | Opens a dialog box in which you can select one or more files for importing application data. After the files have been imported, the variable selection dialog box is displayed. Here you can select the variables whose values you want to accept. |
Read All Calibrations from File | Opens a dialog box in which you can select one or more files for importing application data. All variables from the selected files are accepted. |
Write to PaCo File | Writes the variables of the current dataset to a PaCo file. |
Write to CDF File | Writes the variables of the current dataset to a CDF V2.0 file. |
Write to CVX File | Writes the variables of the current dataset to a CVX file. |
Write to DCM File | Writes the variables of the current dataset to a DCM file. |
This menu contains the following functions:
VUI window
Contains menu functions for managing variable user interfaces:
Display VUI Component Names | Shows or hides component names display in the current variable user interface. |
UI Developer Mode | Opens or closes the window editor for a variable user interface. |
ASAM-3MC - Open ASAM-3MC Interface
Opens the ASAM-3MC module in which you can establish and configure a testbed connection for remote control of the control device.
 Calibration Data Manager
Opens the Calibration Data Manager directly from the experiment. This uses the working and reference pages of the currently active device.
The experiment window can be closed independently of the Calibration Data Manager window.
 EATB - ETAS Analytics Toolbox
Opens the EATB window in which you can display measurement data and analyze it.
 MDA - Measure Data Analyzer
Opens the MDA window in which you can display saved measure data and analyze it offline.
Measure Data Converter
Opens a file selection dialog box where you can select measure data files for conversion (file name extension .dat). The measure data converter support the following output formats: ASCII, Matlab M-File, FAMOS, DIADEM and MDF.
This menu contains instrument-specific functions:
Optimize Column Size
When you activate this function, the columns in a table are sized to exactly the same width as the widest entry in each column. The individual column widths can deviate from one another.
Adapts the window size for optimum display depending on the screen size. Ideally, the column width should be such that all contents are fully visible and , where possible, the complete table is shown.
Measure Rate
Opens a dialog box where you can select a time raster for the measure channel.
Variable Order
Opens the Variable Order dialog box for changing the variable order in the display instrument.
Add Variable
Opens the Variable Selection dialog box where you can select variables to add them to the selected display instrument.
Remove Variable
Removes the selected variable from the display instrument.
Removing the last variable from a display instrument will also remove the display instrument itself.
Properties
Opens the Properties dialog box where you can set the display properties of the selected instrument.
Store Current Window Size
If you have modified the window size of an oscilloscope, an xy plotter or of a YT oscilloscope, you can use this function to define the modified size as the default. A new window of the type in question is now created in this size.
Reset Stored Window Size
You can use this function to restore the default size stored in INCA for the oscilloscope, xy plotter or YT oscilloscope.
Autoscale
Scales automatically the value axis of the selected signal in the oscilloscope so that the signal fits optimally into the display field.
Autoscale All Channels
Scales automatically the value axes of all measurement channels in the oscilloscope so that the signals fit optimally into the display field.
Autodistribution
Displays the selected signals in separate display areas; the value axes are scaled in such a way that one signal is being displayed above the next signal without overlapping.
Show Tool Tip
Displays the name of the signals and the axis values at the current position of the mouse pointer as a tooltip.
Analyze Measure Data
Activates the analysis mode.
The following changes in the oscilloscope: Depending on the oscilloscope type, one or two cursors appear. The values of the cursors are displayed in additional columns in the measure variable lists, plus, if applicable, a column with the difference of the values and a column with the dy/dt (gradient). The status bar shows the time values t1 and t2 of cursors 1 and 2 and their difference in seconds.
The gradient is only shown in the YT oscilloscope.
Analysis Setup
Opens a dialog box for configuring the analysis.
This function is only available for the old oscilloscope and the XY plotter, and it is active in analysis mode only.
Screenshot
Copies the contents of the oscilloscope to the clipboard.
Opens the Print dialog box, where you can select the printer and enter additional information for printing the contents of the oscilloscope.
Define Trigger
Opens the Define display trigger condition dialog box, where you can configure a display trigger for the oscilloscope.
The trigger function is only available for the old oscilloscope and the XY plotter.
Activate Trigger
Activates / deactivates the display trigger for the oscilloscope.
The trigger function is only available for the old oscilloscope
and the XY plotter.
You can make this setting only after defining a trigger and before you
start recording.
Trigger Manually
Actuates a manual display trigger for the oscilloscope.
The trigger function is only available for the old oscilloscope and the XY plotter.
Measure Rate
Opens a dialog box where you can select a time raster for the measure channel.
Swap Axis X-Y
Swaps the X and Y axes.
This function is only available for XY plotters.
Variable Order
Opens the Variable Order dialog box for changing the variable order in the display instrument.
Add Variable
Opens the Variable Selection dialog box where you can select variables to add them to the selected display instrument.
Remove Variable
Removes the selected variable from the display instrument.
Removing the last variable from a display instrument will also remove the display instrument itself.
Properties
Opens the Properties dialog box where you can set the display properties of the selected instrument.
This menu shows the CAN output devices and the CAN message lists that you can send to the CAN output devices.
This menu contains the following functions:
Cascade
Cascades the windows in the experiment environment.
Tile Horizontal
Arranges the windows horizontally in the experiment environment.
Tile Vertical
Arranges the windows vertically in the experiment environment.
Arrange Symbols
Arranges the minimized windows (icons) horizontally at the bottom of the experiment environment.
Close All
Removes all windows from the experiment environment.
If you remove windows, a message is displayed when you close the experiment environment later. You can save or discard your changes in the experiment.
Close Active Window
Removes the active window from the experiment environment.
If you remove windows, a message is displayed when you close the experiment environment later. You can save or discard your changes in the experiment.
n Window
Activates the window with the name window.
...
Further windows analog to the previous entry.
This menu contains the following functions:
Hotkey Assignment
Opens the dialog window Hotkey Assignment for Active window. Here you can view the hotkey assignments for each active Measuring or Calibration Window. If you have not set up a Measuring or Calibration Window yet, you are shown the hotkey assignments for the experiment environment.
Help on Current Window
Opens the Experiment Environment help.
Help
Opens the INCA help.
Manuals and Tutorial
Opens the directory in which the INCA Manuals and the Tutorial are stored.
Video Tutorials
Opens an overview listing all video tutorials for INCA. You can access the videos directly from the overview.
About
Opens an information box about INCA
Support
Opens an information field with information on the respective country-specific INCA hotlines.
Safety Advice
Opens the warnings about the use of INCA.
...
Further windows analog to the previous entry.
In the Experiment Environment, the Device Information bar contains the following columns and fields:
Device Name
Lists all added devices. Defines the currently active device. If you make any changes in the device information list, these changes apply only to the device marked with the blue arrow. |
Memory Page Manager
| Opens the Memory pages device window, in which you can view, compare and edit the INCA datasets and the memory pages in the ECU. |
WP/RP option fields
Selects the working dataset or the reference dataset for the experiment.
Specifies which datasets are used as the working dataset and the reference dataset.
Cluster

| Defines whether the control device cluster is activated or deactivated. An activated cluster enables to switch multiple control devices between working page and reference page within the INCA Experiment Environment. A deactivated cluster enables to switch between the pages of each controller separately. |

Grouped
  | Defines whether the control device group is activated or deactivated. An activated device group enables joint calibration of all control devices in the group. A deactivated device group enables separate calibration of each control device. You can make these settings only if you have first generated and saved a control device group in the hardware configuration editor. |
Start/Stop
 | Stops the operating system of the selected device. |
 | Starts the operating system of the selected device. |
Note |
This column is only displayed when using E-Target devices. |
Diff
Specifies the number of differences between the selected working dataset and the values in the ECU. Access to the ECU must be enabled first.
Calibration Scenario Editor combo box
Sets current active scenario for the Calibration Scenario Editor. Active device is labeled with  .
.
WP | Working Page |
RP | Reference Page |
OWP | Original working page |
Note |
While you are scrolling, the active device changes. |
Minimizes the device information list to its former size. | |
Expands the complete device information list temporarily. | |
 | Sets the height of the device information list to the displayed size. The device information bar gets integrated into the INCA experiment window. |
Note |
Only columns that are active are shown in the Device Information bar. For example, if the devices are not grouped, the grouped column does not show up. |
To open the context menu, right-click on the Device Information bar.
This menu contains the following functions:
Manage memory pages...
| Opens the Memory pages device window, in which you can view, compare and edit the INCA datasets and the memory pages in the ECU. |
Switch Between Working/Reference Page
Switches between the working dataset or the reference dataset for the experiment.
Specifies which datasets are used as the working dataset and the reference dataset.
Active Device Group
 | Defines whether the control device group is activated or deactivated. An activated device group enables joint calibration of all control devices in the group. A deactivated device group enables separate calibration of each control device. You can make these settings only if you have first generated and saved a control device group in the hardware configuration editor. |
Move the selected device up
Moves the selected device up the device information list.
Move the selected device down
Moves the selected device down the device information list.
Minimize the device list
Minimizes the device information list to its former size.
The left icon bar contains the following icons:
| Closes the current experiment and creates a new, empty experiment. If you changed any settings in the previous experiment, a message box appears. You can specify whether you want to save your changes, or not. |
| Opens the Load dialog box where you can select an experiment you want to open. If you changed any settings in the previous experiment, a message box appears. You can specify whether you want to save your changes, or not. |
| Saves the current settings in the experiment environment. |
| Opens a dialog box in which you can select a file with a variable user interface for opening (file ending .vui). |
| Opens the Hardware: hw Experiment: exp window where you can configure hardware. If the window is already open, it is placed in the foreground. The Experiment: exp Hardware: hw window remains open. |
| Changes to the INCA main window. The Experiment: exp Hardware: hw window remains open. |
| Opens the Variable Selection dialog on the Variables tab where you can select the variables for use in the experiment. |
| Opens the Variable Selection dialog on the Display Configuration tab where you can configure the display of the elements that are used in the experiment. |
| Opens the Variable Selection dialog on the Variables Configuration tab where you can configure the recording status and the raster assignment of the variables that are used in the experiment. |
| Opens the Manage Calculated Signals dialog box, in which you can create and manage new mathematically linked measure variables from existing measure variables. You can define calculated signals for all devices that return a raster-related measure signal. |
| Stops the current measurement. Both the display and the recording of measurement data are stopped. When you have finished recording, the dialog box Recording information for: file opens in which you can save the recorded save data. |
| Starts measurement and displays the measurement data continuously. Measure data visualization is only possible in online mode. If you opened the experiment in offline mode with the setting Experiment without full HW access, you have to initialize the hardware explicitly before you can start visualizing measure data. |
| Starts recording and display of measurement data. Measure data recording is only possible in online mode. If you opened the experiment in offline mode with the setting Experiment without full HW access, you have to initialize the hardware explicitly before you can start recording measure data. |
| Stops recording of measurement data. The display of the measurement data is not closed. The Insert pause comment dialog box opens where you can specify a reason for the pause. |
| Opens the Recorder configuration in which you can make settings for recording measurement data, see Configuring a Recorder. |
| Opens the Recorder Manager, see Overview of Recorder Manager. |
| Opens the MDA window in which you can display stored measurement data and analyze it offline. |
| Opens the EATB - ETAS Analytics Toolbox window in which you can display measurement data and analyze it. |
| Starts or exits the Interface Editor for the current variable user interface. |


The lower icon bar contains the following icons and folders:
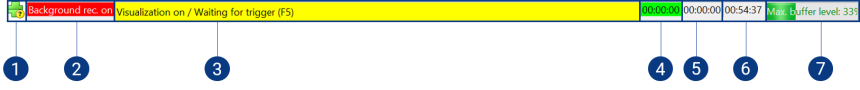
- Icon for hardware and firmware status
- Recorder status
- Experiment status
- System load
- Recording time so far
- Remaining recording time
- Max. buffer level
Icon for hardware and firmware status
Note |
When you click on the icon for hardware and firmware status, the Hardware Status dialog box opens with more detailed information about the hardware used in the experiment. |
The icon displayed in the lower toolbar of the experiment environment represents a summary of the hardware and firmware status.
The base icon (e.g.  or
or  ) shows the initialization status of the hardware. The icon
of the firmware status is displayed as on overlay.
) shows the initialization status of the hardware. The icon
of the firmware status is displayed as on overlay.
Example:
 | Combination of firmware and INCA version is not longer allowed. |
 | Hardware is connected and firmware is up to date. |
 | Firmware is not supported. |
 | Hardware is not connected, firmware is not up to date or both. |
 | Firmware check is not supported, even though HSP is available. |
Note |
Checking the firmware is possible only for hardware that is completely supported by HSP The firmware checks initiated by INCA require HSP V7.1.0 or later. |
Displays the current status whether a background recorder is on or off, see Overview of Recorder Manager. The recorder status is only displayed if a background recorder is enabled.
Displays the current status of the measurement.
A system overload is displayed in the status bar. Data transfer between the measuring device and the PC is then no longer simultaneous. Triggering is no longer reliable if a permanent overload results in delays and a data volume that is too large to be buffered completely.
- Green: No system overload, i.e., reliable triggering is possible.
- Yellow: System overload, but reliable triggering is still possible.
- Red: System overload, reliable triggering can no longer be guaranteed since the complete data volume cannot be transferred to INCA.
Shows the elapsed recording duration.
Shows the remaining time for which a continuous recording is possible. The time depends on the amount of data that is being recorded, the current performance, and the disk space that is available for INCA temp files.
Displays the current fill level of the memory buffer.