Scatter Plot
The  following menu options open a scatter plot window.
Depending on the combination of menu and sub menu items used to open the window, the name of the scatter plot window can be Data - * or Function Node - * or Data and Nodes - * or Residuals over ** or Measured vs. Predicted.
The Scatter Plot window contains the following elements:
-
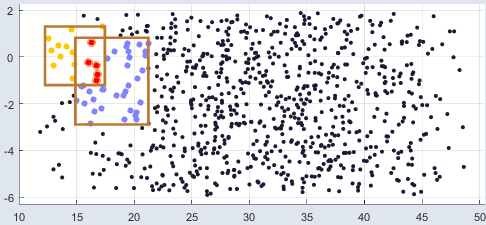
Remove all Rectangles
Removes all rectangles drawn in this window.
-
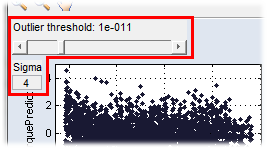
Set Outlier Threshold (Residuals over * and Measured vs. Predicted windows only)
Shows the Outlier Threshold slider (adjustable value range: 10‑14 to 1 (level of significance)) and the Sigma editing field (value of standard devation) in the plot window. -
Detect and Mark Outlier (Residuals over * and Measured vs. Predicted windows only)
Identifies all outliers determined according to the defined criteria and marks them with a red circle.
-
Unmark All Points
The marking of previously identified outliers is removed.
-
Delete Marked Points
The marked points will be deleted.
-
Set Marked Points Active
Active points are taken into account during RMSE calculation and optimization.
-
Set Marked Points Inactive
Inactive points are ignored during RMSE calculation and optimization.
-
Set Marked Points Weights
Opens the "Data Weights" window where you can enter a weight for the selected data points.
-
Select Axes
Opens the Select Axes window, where you can select the axes pairs to be plotted.
-
Additional Scatter Plot
Opens the Select Axes window, where you can select the axes pairs to be plotted. This Scatter Plot is displayed in another additional window and linked to the original Scatter Plot, so they have the same data base and depend on each other. This applies to every additional window.
-
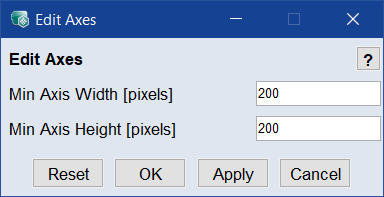
Plot Settings
Opens the
Edit Axes window where you can set the minimal size of the plots in pixel. If you change the Min Axis Width or Min Axis Height and click OK or Apply, each scatter plot smaller than the new values is adapted automatically so that it reaches the minimal size you set. If necessary, scrollbars appear for navigation.Note
The information in the Edit Axes window will be saved in ASCMO-MOCA and used in all scatter plots.
-
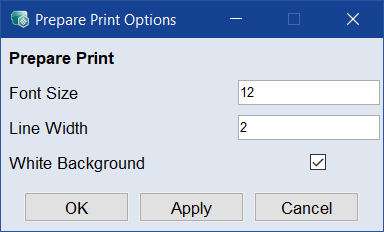
Prepare Print
Opens the
Prepare Print Options window where you can adjust the look of the plot area. The settings are reset when you close the plot window. -
Save as Bitmap
This allows the content of the window to be saved in a series of graphic formats.
-
Copy to Clipboard
Copies the window content to the clipboard.
-
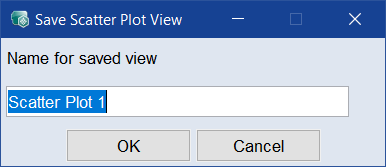
Save View/Save View as (Data -*, Function Node - * and Data and Nodes - * windows only)
Opens the
Save Scatter Plot View window, where you can store the current layout of the scatter plot window under a user-defined name. See also Selecting Scatter Plot Axes. You can later re-open the layout of the saved scatter plot by selecting My Views → <view_name> in the main window.
-
Load View
Opens the Select Saved View window, where you can select a view to be opened.
-
Remove Saved View (Data -*, Function Node - * and Data and Nodes - * windows only)
Removes the currently selected view from the My Views → <view_name> list in the main window.
-
Filter Data (Data -*, Function Node - * and Data and Nodes - * windows only)
Opens the Filter Data window where you can specify a filter for the data. See also Filtering Data.


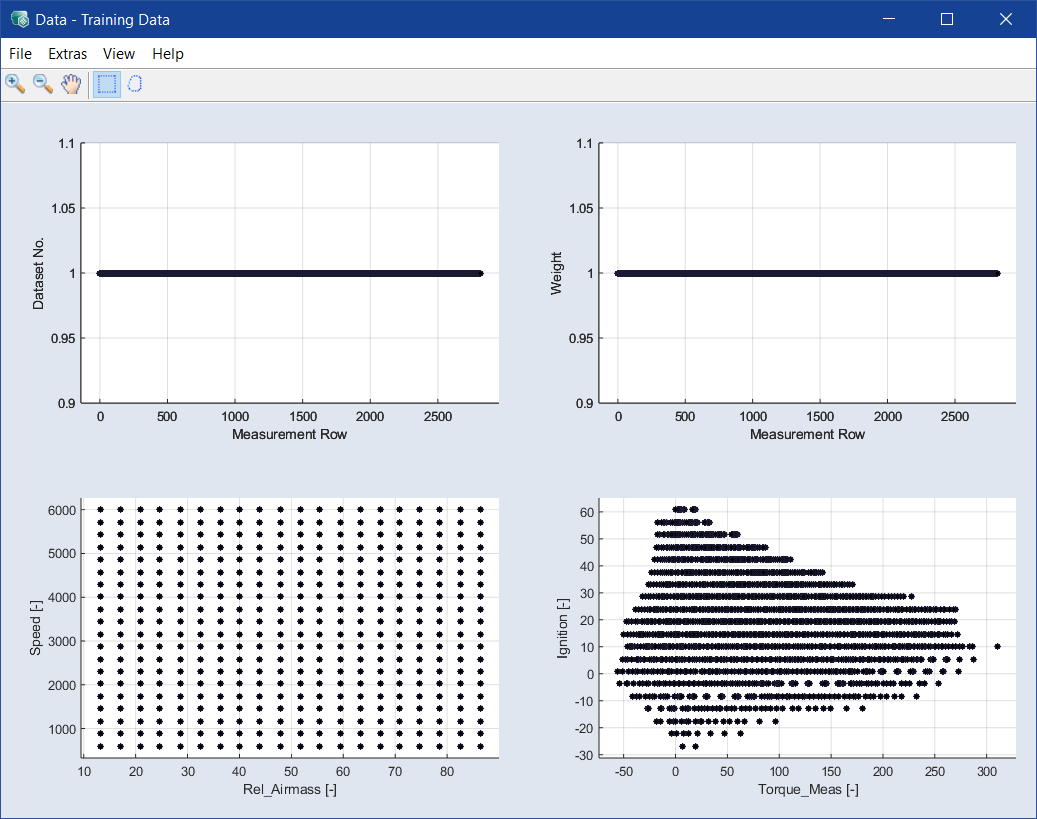
Plot area
This area shows the scatter plot(s).
You can
Select scatter plot axes (Data -*, Function Node - * and Data and Nodes - * windows only)
Filter the data (Data -*, Function Node - * and Data and Nodes - * windows only)
See also
Function Assessment and Improvement