Drawing a Rectangle
-
Click in the plot.
-
Keep the mouse button pressed and draw a rectangle around the desired points.
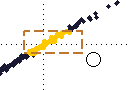
Or - as an alternative - do the following:
-
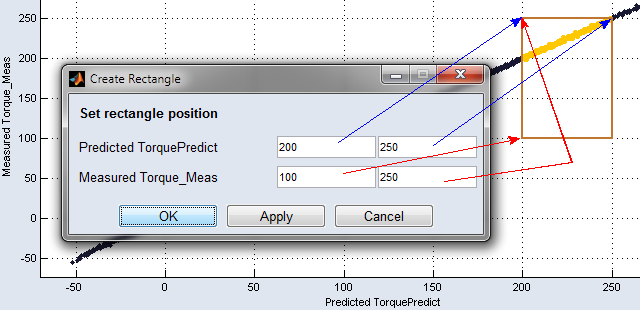
Right-click in the plot and select Create Rectangle from the context menu.
The "Create Rectangle" window opens.
-
In that window, enter the start and end points for both axes, then click on OK.
The rectangle is positioned and sized according to your settings; see
 example.
See also