Selecting Scatter Plot Axes
To select and store axes pairs for scatter plots, proceed as follows.
-
In the scatter plot window, select View → Select Axes.
The "Select Axes" window opens.
-
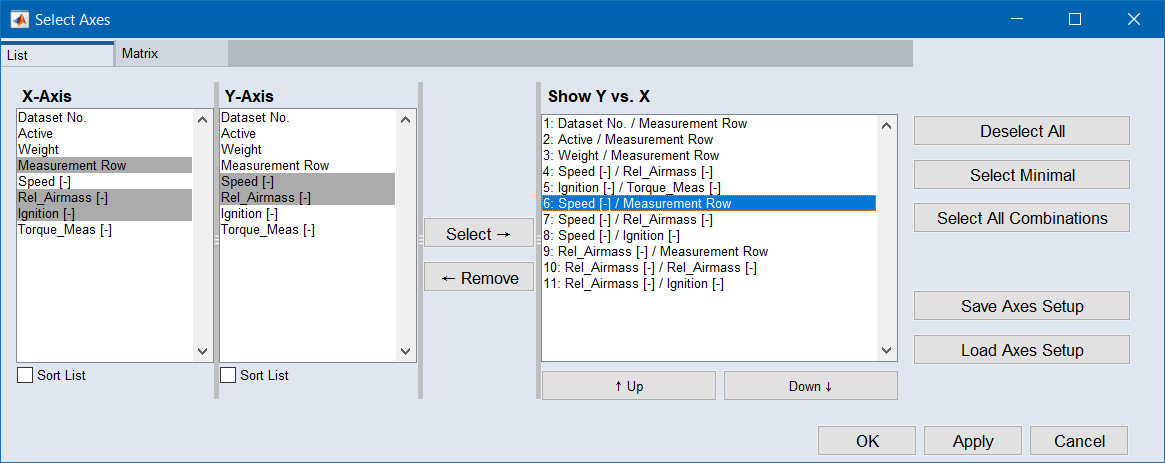
To select axes in the "List" tab, proceed as follows:
-
Go to the "List" tab.
-
In the "X-Axis" list, select one or more inputs to be used as X axis for a 2D plot.
-
In the "Y-Axis" list, select one or more inputs to be used as Y axis for a 2D plot.
-
Click on Select.
Combinations of each selected X axis with each selected Y axis are added to the "Show Y vs X" list (see the
 example).
The same axes pairs are selected in the "Matrix" tab.
-
-
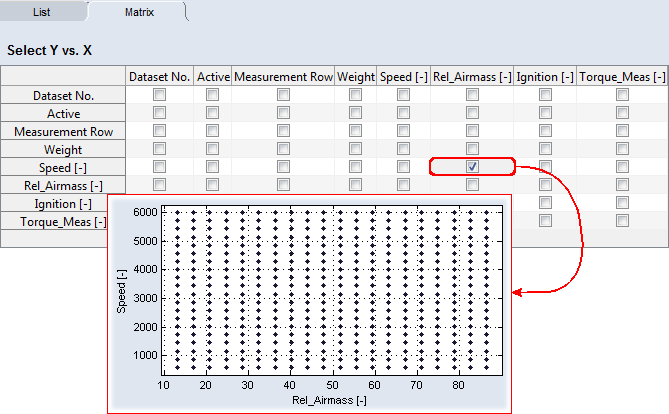
To select axes in the "Matrix" tab, proceed as follows:
-
Go to the "Matrix" tab.
-
Activate the options for the scatter plots you want to show.
The matrix rows correspond to Y axes in the scatter plots, the matrix columns correspond to X axes (see the
example).The same axes pairs are selected in the "List" tab.
-
-
If desired, click on Save Axes Setup to store the selection of axes pairs in an *.ini file.
The axes pairs can later be reloaded (Load Axes Setup).
-
Click on OK or Apply to apply your settings.
The selected scatter plots are shown in the scatter plot window.
-
To save the layout of the scatter plot, proceed as follows.
-
In the scatter plot window, select View → Save View/Save View as.
The "Store Scatter Plot View" window opens.
-
Enter a name for the layout, then click on OK.
The layout of the scatter plot window is stored.
You can later re-open the layout of the saved scatter plot by selecting My Views → <view_name> in the main window.
-
See also