Data Menu (ASCMO-DYNAMIC)
The Data menu consists of the following entries:
The data of the datasets are displayed as tables. There is a tab for each dataset. Data can be changed in the table. See also Data Table.
Opens the Scatter Plot window.
The scatter plot is useful during model validation to verify that the validation or test data are in the range of the input data. This is crucial since ETAS ASCMO-DYNAMIC uses a data-driven modeling algorithm that cannot guarantee a reliable extrapolation into areas not covered.
Manage Data Sets
Opens the "Manage Datasets" window, where you can rename or delete a dataset, and edit the dataset labels. See also Managing Datasets.
Guided Dataset Selection
Starts the assisted categorization of datasets as training data, validation data, or test data. The Guided Dataset Selection - Settings window opens. See also Performing Guided Dataset Selection.
Resampling
Opens the "Resampling" window, where you can change the sample time of the datasets. See also Resampling.
Noise Filtering
Opens the "Noise Filtering" window where you can determine the size of a noise filter window and start the filtering. See also Noise Filtering.
Show Statistics
Opens the "Statistics" window, which provides a tabular overview of the datasets' statistics.
Cross Correlation Inputs
|
Note |
|---|
|
This item is only available when the Advanced Settings are enabled (see Enabling the Advanced Settings). |
Opens the "Cross Correlation of Input" window where you can check if your inputs are uncorrelated. See also Cross Correlation Inputs.
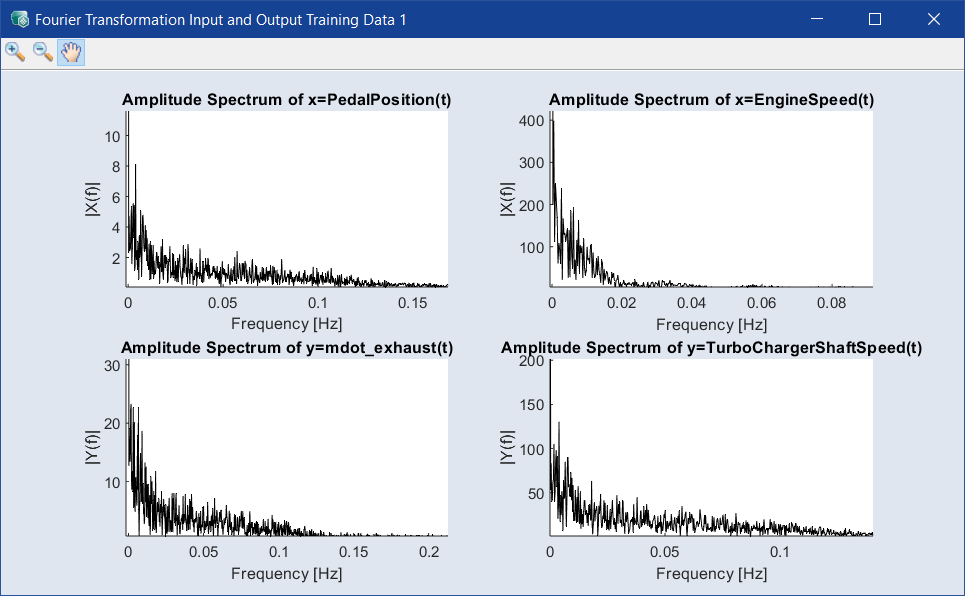
Opens the  "Fourier Transformation Input and Output" window, which displays the amplitude spectra of the inputs and outputs.
More or less narrow peaks indicate the presence of noise of more or less defined frequency.
Phase Plot and ACF/IACF Outputs
Opens the "Time Dependency Analysis Output" window, where you can identify the time dependency of the identification task. Each output is shown in a different window. See also Phase Plot and ACF/IACF Outputs.