Absolute Value Bar Chart
Note |
This INCA feature is available only if the INCA-EV-Instruments add-on is installed. For more information, see the INCA Installation Guide. Select ? > Manuals and Tutorials. |
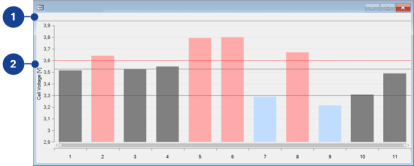
The Absolute Value Bar Chart provides a bar graph that displays the measure variable and highlights the variable value outside of user-defined limits. For example, a battery measurement displays the cell voltages and highlights cells whose voltage exceeds user-defined limits. This allows you to get an overview of the battery cell voltage values and to identify cells that exceed a voltage limit at a given point in time. The cell voltages are represented by vertical bars, sorted from left to right from lower to higher cell numbers.
This instrument consists of the following components:
Number of Signals
Displays the number of measure variables assigned to the instrument.
Average
Displays the average value of all measure variables assigned to the instrument.
Total Values
Displays the total value of all measure variables assigned to the instrument.
Min Value
Displays the minimum value of all measure variable assigned to the instrument.
Max Value
Displays the maximum value of all measure variable assigned to the instrument.
Neg Imbalance
Displays the highest negative deviation from the average value of all measure variable assigned to the instrument.
Pos Imbalance
Displays the highest positive deviation from the average value of all measure variable assigned to the instrument.
Signal values
The graph shows the measure variable values of all variables as vertical bars. The height of each bar represents the value of the specific measure variable. Measure variables whose values exceed the lower or upper limit are highlighted.
Bar Color | Description |
|---|---|
Color | Values exceeding the lower limit |
Color | Values within the limits |
Color | Values exceeding the upper limit |
Limits
Upper and lower limits are shown as horizontal lines.
Line Color | Description |
|---|---|
Color | Upper limit |
Color | Lower limit |
To open the context menu, right-click in the Absolute Value Bar Chart window.
This menu contains the following functions:
Measure Rate
Opens a dialog box for changing the raster for the selected measure variables if more than one measure rate is possible. You can also see information here about the default raster.
Add Variable
Adds another variable to the window.
Remove Variable
Removes a variable from the window.
Copy Variable to Window
Copies one or more variables to another window.
Move Variable to Window
Moves one or more variables to another window.
Copies variable names to the clipboard.
About Variable
Opens the About Variable dialog box.
Properties
Opens the Properties dialog box.
The instrument properties are displayed in the following tables:
This table contains the following properties:
Name
Displays the name of the bar chart instrument.
Upper and Lower Limit [V]
Displays the upper and lower limits of the values of the measure variable.
Name
Displays the names of the measure variables contained in the bar chart instrument.
Device
Displays the name of the devices to which the measure variable belongs.
See also