Sortable List
Note |
This INCA feature is available only if the INCA-EV-Instruments add-on is installed. For more information, see the INCA Installation Guide. Select ? > Manuals and Tutorials. |
The Sortable List is an instrument for measure value analysis. For example, the battery of an electric vehicle consists of many individual cells. Of the entire battery, only the cells with the highest or the lowest voltage values are important, as these define the overall battery capabilities during charging and discharging. This instrument allows you to quickly identify the measure variables with the highest deviation from the average value of many comparable measure variables.
For example, you can use the Sortable List to do the following:
Determine the voltage range in battery cells.
Determine the imbalance of the battery cells.
Sort the table by name, imbalance, and cell voltage.
This instrument consists of the following components:
Number of Signals
Displays the number of measure variables assigned to the instrument.
Average
Displays the average value of all measure variables assigned to the instrument.
Total Values
Displays the total value of all measure variables assigned to the instrument.
Min Value
Displays the minimum value of all measure variable assigned to the instrument.
Max Value
Displays the maximum value of all measure variable assigned to the instrument.
Neg Imbalance
Displays the highest negative deviation from the average value of all measure variable assigned to the instrument.
Pos Imbalance
Displays the highest positive deviation from the average value of all measure variable assigned to the instrument.
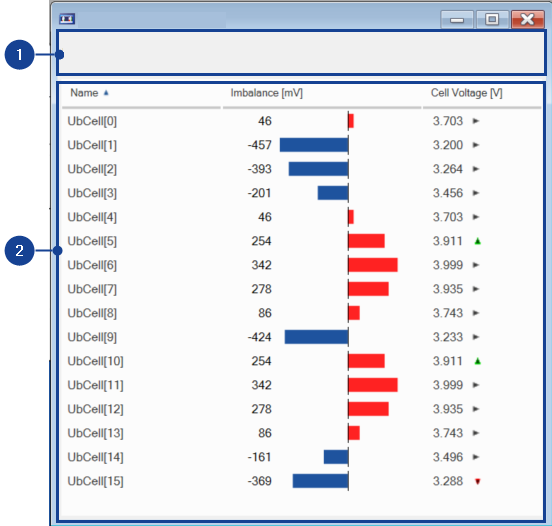
Name
Displays the names of the measure variables contained in the Sortable List.
Imbalance [-]
Displays the imbalance of the variable value, for example voltage imbalance of battery cells. The imbalance bars displayed for each measure variable are colored red or blue.
Bar Color | Description |
|---|---|
---- | Positive deviation from the average value of all measure variables, for example, average voltage of all battery cells. |
---- | Negative deviation from the average value of all measure variables, for example, average voltage of all battery cells. |
Signal Value [-]
Displays the variable value, for example, voltage of the battery cell. The arrows indicate the following:
| The value of the subsequent sample is lower than the current sample. |
| The value of the subsequent sample is the same as the current sample. |
| The value of the subsequent sample is higher than the current sample. |


To open the content menu, right-click in the Sortable List window.
This menu contains the following functions:
Measure Rate
Opens a dialog box for changing the raster for the selected measure variables if more than one measure rate is possible. You can also see information here about the default raster.
Add Variable
Adds another variable to the window.
Remove Variable
Removes a variable from the window.
Copy Variable to Window
Copies one or more variables to another window.
Move Variable to Window
Moves one or more variables to another window.
Copies variable names to the clipboard.
About Variable
Opens the About Variable dialog box.
Properties
Opens the Properties dialog box.
The instrument properties are displayed in the following tables:
This table contains the following properties:
Name
Displays the name of the Bar Chart Instrument.
Unit
Displays the unit of the measure variable.
Imbalance Unit
Displays the imbalance unit of the measure variable.
Conversion Factor
Defines the conversion factor of the bar chart instrument.
Name
Displays the names of the measure variables contained in the bar chart instrument.
Device
Displays the name of the devices to which the measure variable belongs.
See also