Signal Distribution Chart
Note |
This INCA feature is available only if the INCA-EV-Instruments add-on is installed. For more information, see the INCA Installation Guide. Select ? > Manuals and Tutorials. |
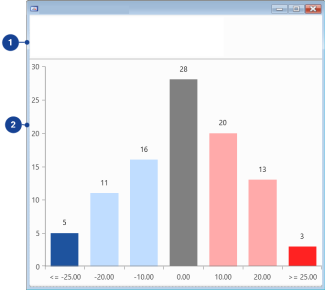
The Signal Distribution Chart is an instrument for statistical analysis. The histogram is calculated based on the imbalance values of the individual measure variables at a given point in time. In the histogram, the height of each bar represents the number of variables that fall within the defined value range of the respective bucket.
This instrument consists of the following components:
Number of Signals
Displays the number of measure variables assigned to the instrument.
Average
Displays the average value of all measure variables assigned to the instrument.
Total Values
Displays the total value of all measure variables assigned to the instrument.
Min Value
Displays the minimum value of all measure variable assigned to the instrument.
Max Value
Displays the maximum value of all measure variable assigned to the instrument.
Neg Imbalance
Displays the highest negative deviation from the average value of all measure variable assigned to the instrument.
Pos Imbalance
Displays the highest positive deviation from the average value of all measure variable assigned to the instrument.
The height of each bar displays the number of variables that fall within the defined value range of the respective bucket. The imbalance bars displayed for each measure variable are colored in different colors.
Bar Color | Description |
|---|---|
| Color | Variables with imbalance values lower than the lowest bucket |
Color | Variables with negative imbalance values |
Color | Variables with imbalance values around 0 |
Color | Variables with positive imbalance values |
Color | Variables with imbalance values higher than the highest bucket |
To open the context menu, right-click in the Signal Distribution Chart window.
This menu contains the following functions:
Measure Rate
Opens a dialog box for changing the raster for the selected measure variables if more than one measure rate is possible. You can also see information here about the default raster.
Add Variable
Adds another variable to the window.
Remove Variable
Removes a variable from the window.
Copy Variable to Window
Copies one or more variables to another window.
Move Variable to Window
Moves one or more variables to another window.
Copies variable names to the clipboard.
About Variable
Opens the About Variable dialog box.
Properties
Opens the Properties dialog box.
The instrument properties are displayed in the following tables:
This table contains the following properties:
Name
Displays the name of the Bar Chart Instrument.
Unit
Displays the unit of the measure variable.
Imbalance Unit
Displays the imbalance unit of the measure variable.
Conversion Factor
Defines the conversion factor of the bar chart instrument.
Name
Displays the names of the measure variables contained in the bar chart instrument.
Device
Displays the name of the devices to which the measure variable belongs.
See also