<input> Calibration Map
Calibration menu > Calibration Maps.
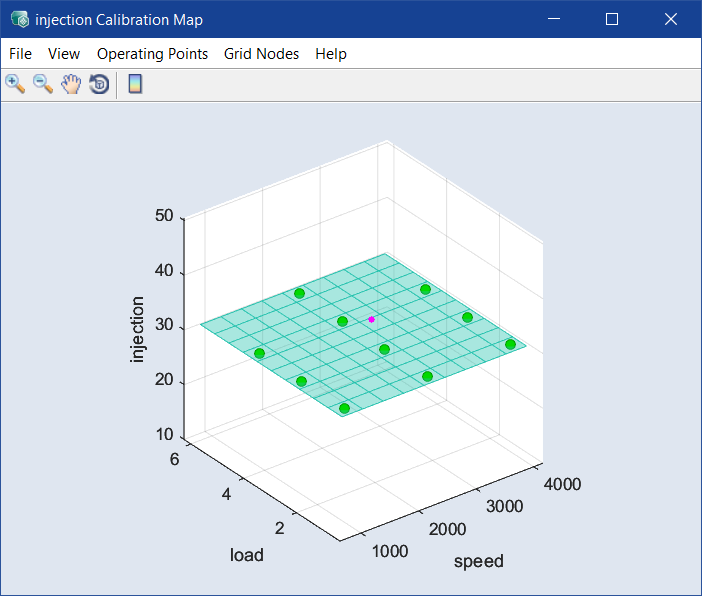
The <input> Calibration Map window contains the following elements:
 File
File
-
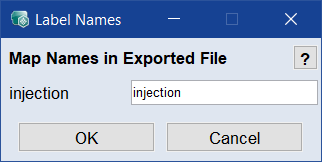
Saves the map of this input as DCM or CSV file (<project name>_CM_<input>.*). First, you can assign a name for the label.
-
Import
Load a map that was previously saved (*.dcm/*.xls/*.xlsx/*.xlsm/*.csv/*.ascmo).
-
Sets the maps shown (working map), or all maps, as a reference map. The relevant icons in the toolbar are used to control whether the working or reference map is displayed.
-
Resets the working map to a value previously set as reference.
-
Copy to Clipboard
Copies the plot to the clipboard.
-
Save as Image
Saves the plot as a *.bmp, *.png, or *.jpg image.
-
Close
Closes the window.
View
-
Visible Z-Range
Opens the
Visible Z-Range window where you can change the display range of the Z-axis.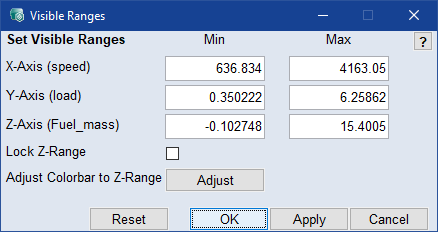
Note
The Adjust button is available only if the color bar is displayed.
-
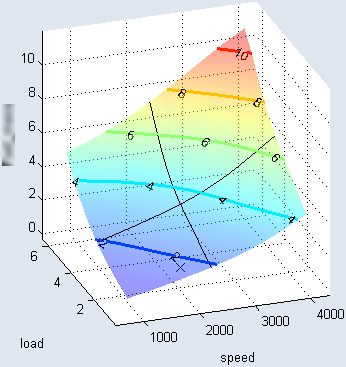
Contour Mode
Shows/hides the
contour lines in the plot.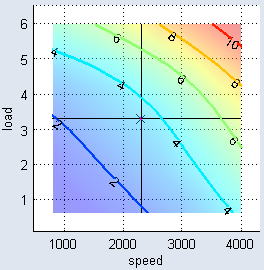
-
Contour Options
Note
Only available if Contour Mode is enabled.
Use the submenus to set up the contour lines.
Contour Properties
Opens the Contour Properties window where you can adjust the properties of the contour lines.
Set labels manually
Shows only the contour lines and offers a cross-hair cursor to insert labels. Click in the plot to enter a label at the cursor position.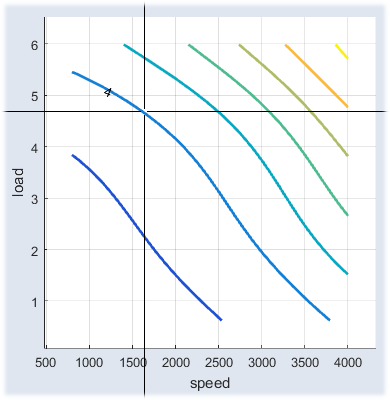
To end the insert mode, click outside the plot, or move the cursor outside the plot and press the<Esc> key.
-
Show Toolbar
Allows showing and hiding the toolbar of the window.
-
Show Cursor
Shows or hides the pink dot and black X that mark the selected operation point.
-
Prepare Print
Opens the
Prepare print Options window where you can adjust the look of the plot area. The settings are reset when you close the plot window.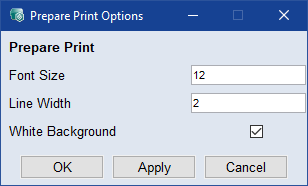
-
Map Bounds
Allows displaying the limits of the measured area if they were previously customized (see Map Bounds).
-
Driving Cycle
Shows the
driving cycle traces (see also Driving Cycle) in the calibration map.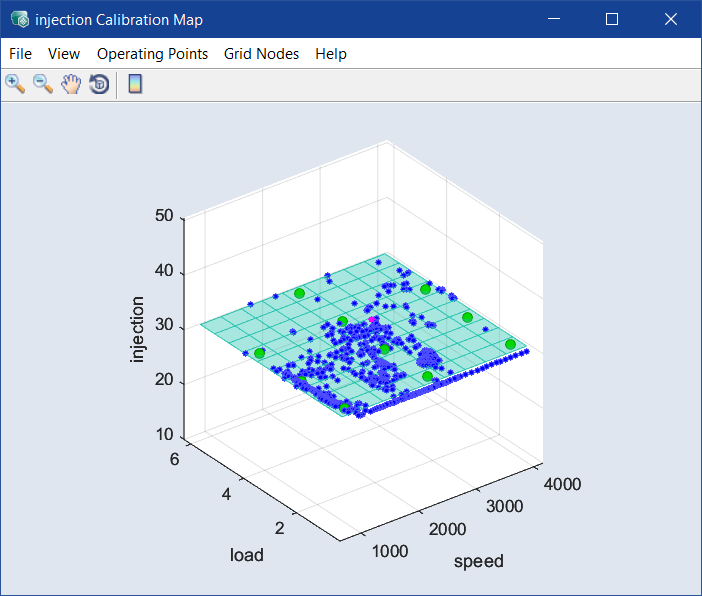
-
Show Grid
Shows the base point grid currently defined for the map (see also the Grid Nodes menu). This checkbox is enabled by default.
-
Update ISP Online
If this checkbox is enabled, all intersection plots in the ISP view are immediately updated upon changing the results (moving the colored points with the mouse or changing in the table).
-
Working Page
Displays the editable calibration map.
-
Reference page
Displays the corresponding reference map.
Select File > Set as Reference Page to convert the working map in a reference map.
Operating Points
-
Opens a
table with the operating points and the optimized values of the respective input, which can be edited.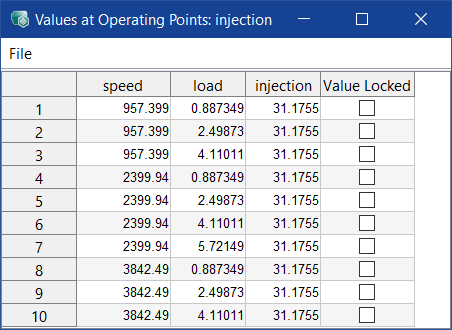
-
Lock selected OP
Locks the currently selected operating point in the active calibration map.
-
Lock selected OP in all CMs
Locks the currently selected operating point in all calibration maps.
-
Lock OPs in-/outside Cycle Trace
Opens the Lock OPs in-/outside Driving Cycle window where you can lock the operating points for the calibration map in this window inside or outside the convex hull of a selected driving cycle.
-
Lock OPs in-/outside Cycle Trace in all CMs
Opens the Lock OPs in-/outside Driving Cycle window where you can lock the operating points for all calibration map inside or outside the convex hull of a selected driving cycle.
-
Lock OPs outside Training Data in all CMs
Locks all operating points outside the training data in all calibration maps.
-
Unlock all OPs in all CMs
Unlocks all locked operating points of all calibration maps again. Then, the operating points can be changed by dragging the grid.
Grid Nodes
-
Changes the display of the optimized values from the operating points to the nodes of the base point grid. The values at the operating points are displayed as small blue points.
-
Grid Nodes
Allows adjusting the base point grid in different ways.
-
Define Grid Nodes
Allows
defining the number of base points for a new grid as well as the base points values. If the Apply to all Maps checkbox is activated, this change is applied to all input maps.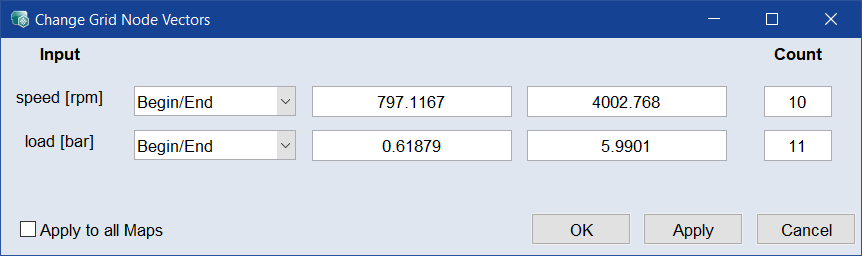
-
Allows
adapting the grid of the operating points at which optimizations were performed as base point grid.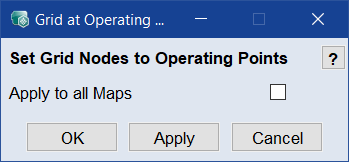
With the Apply to all Maps checkbox, the new base point grid is applied to all calibration maps.
-
-
Smoothing
A slider editor appears in the plot window with which you can smooth the map (not in Edit Grid mode).
-
Table
The calibration map displayed in the plot window is displayed as a table. The values of the table can be saved via the File menu, or values can be loaded from a file.
-
User Guide: Opens the PDF User Guide.
-
Online Help: Opens the online help (F1).
-
Interface Help: Opens the interface help.
-
License: Opens the ETAS License Manager.
-
Support: Displays contact information for various ETAS support channels.
-
Safety Advice: Opens the ETAS safety advice.
-
About: Opens the About window, where you can also get information about OSS used in ASCMO.
Toolbar
The toolbar of the window contains the following elements:

|
Zoom In | Clicking in the plot will enlarge the plot representation. |

|
Zoom Out | Clicking in the plot will reduce the plot representation. |

|
Pan | Thus, the plot can be shifted within the window. |

|
Rotate 3D | Thus the 3D plot can be rotated in all three spatial directions. |

|
Insert Colorbar | Displays the current color table with the axis scaling. |
Plot area
Displays the 3D plot of the respective input calibration map.