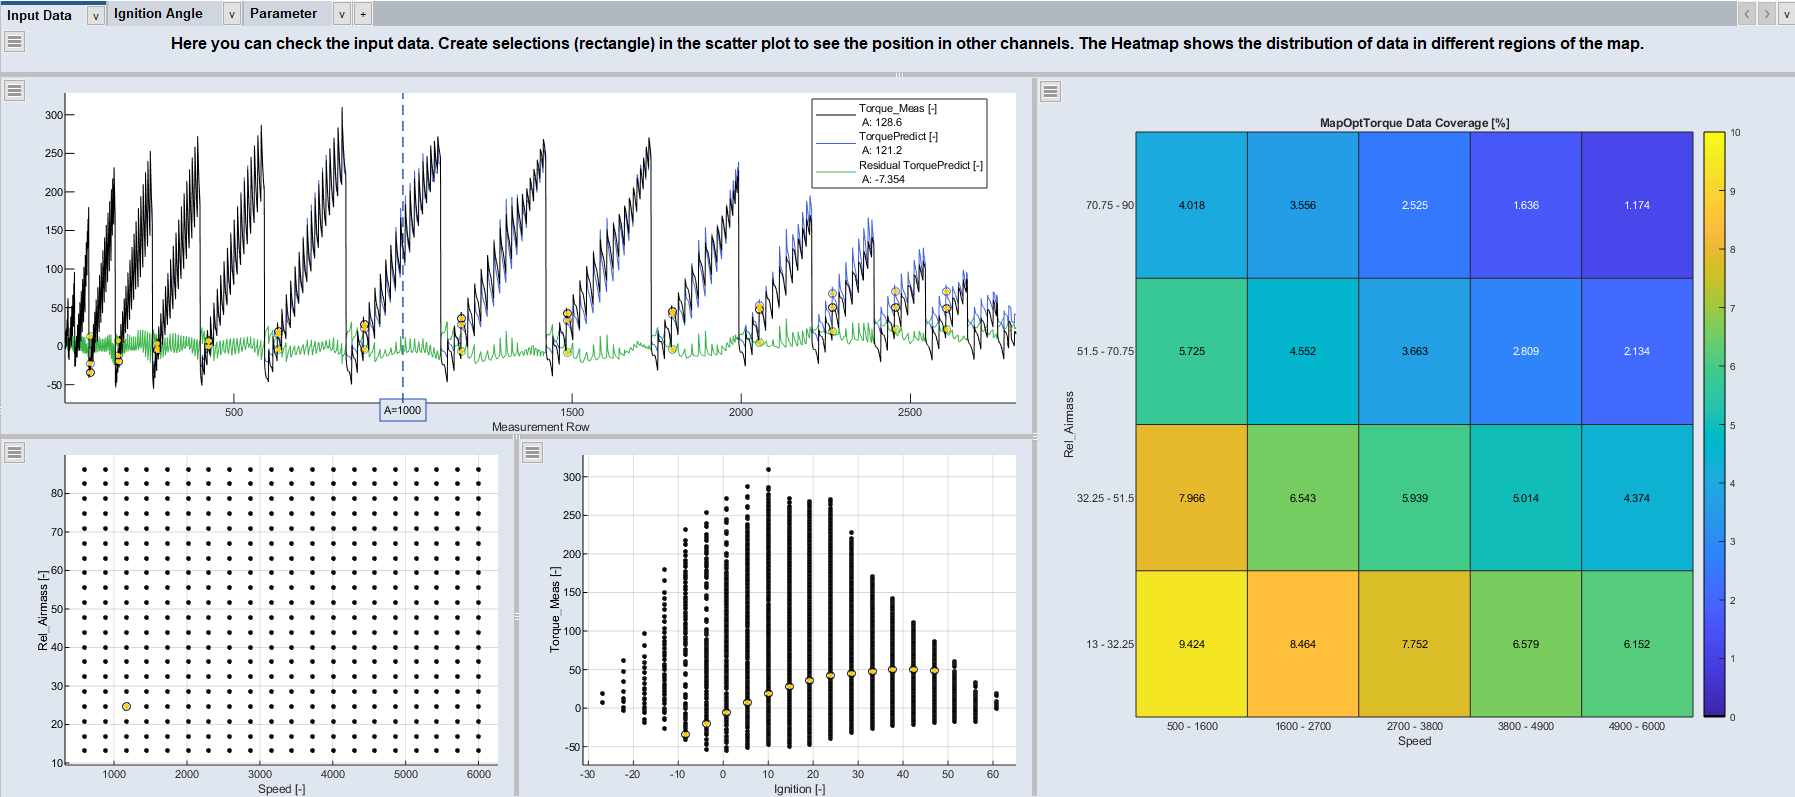
Scatter Plot
Scatter plot windows are used frequently in ASCMO-DYNAMIC.
|
Note |
|---|
|
Changes in the scatter plot view are not saved. When you close the window, your changes are discarded. |
The Scatter Plot window contains the following elements:
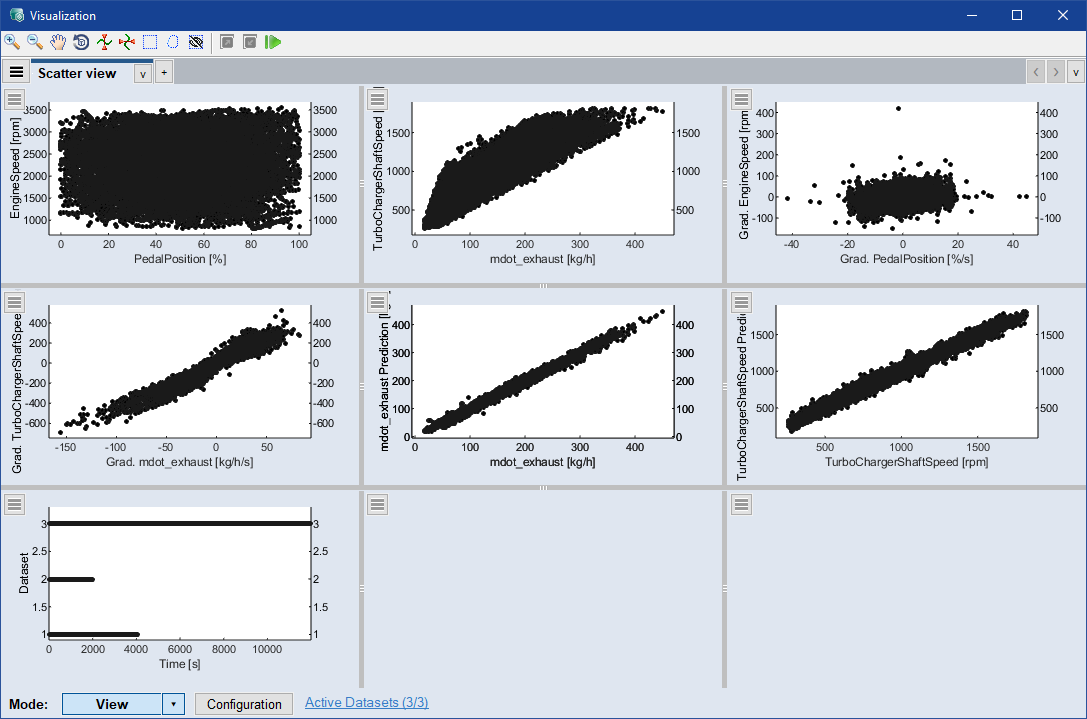
<Visualization Name> tab
Each visualization view can be divided into different parts or areas called elements. These elements can be filled with text or visualizations like signal or parameter plots.
Click  to open the menu for all tabs.
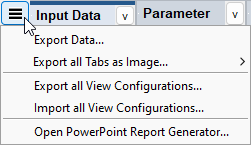
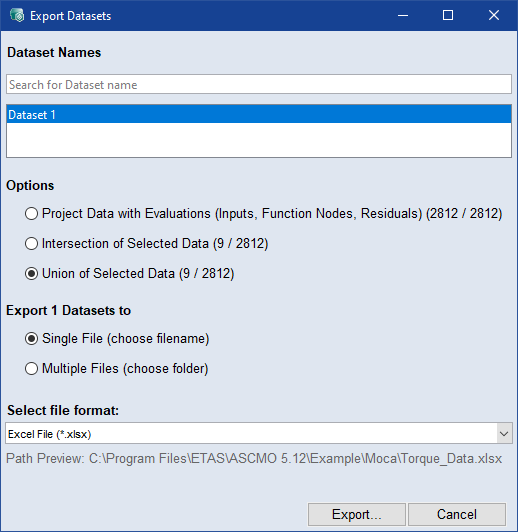
Export Data: Opens the  Export Datasets window where you can specify the settings for the export to *.xls / *.xlsx, *.csv, *.dat, *.mf4, or *.mat.
-
Project Data with Evaluations: Exports the mapped input data, nodes, criterias, and evaluations.
-
Intersection of Selected Data: Exports the intersection of the selected data. The number of data points this affects is shown in parentheses.
-
Union of selected Data: Exports the union of the selected data. The number of data points this affects is shown in parentheses.
-
Single File: Exports selected datasets to a single file. After clicking Export..., you can specify the file name and select the file path.
-
Multiple Files: Exports selected datasets to multiple files. After clicking Export..., you can specify the folder name and select the file path. The dataset names are used as file names.
-
Select File Format: Select from Excel (*.xls), Excel 97-2003 (*.xlsx), Comma Separated Values (*.csv), MDF3 Measurement Data Format(*.dat), MDF4 Measurement Data Format(*.mf4), or MAT (*.mat) file.
Export all Tabs as Image: Exports all tabs separately to the selected file format. You must specify the location.
Export all View Configurations: Exports all configurations of all visualization tabs to a JSON file.
Import all View Configurations: Imports all configurations of all visualization tabs from a JSON.
Open PowerPoint Report Generator: Opens the Report Generator window, where you can create PowePoint reports filled with visualization elements.
Click
 or right-click the tab to open the tab menu.
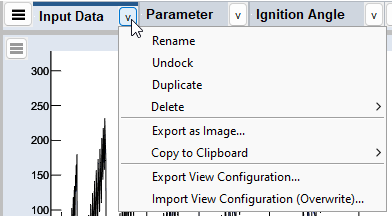
Rename: Renames the tab. You can also double-click the tab to rename it.
Undock: Undocks the tab from the main window to a new window.
Dock: Docks the tab back to the main window. This option is only available for undocked tabs. Closing the undocked tab window also docks the tab back to the main window.
Duplicate: Creates a duplicate of the tab as a separate tab.
Delete:
-
Current View: Deletes the tab you opened the menu from.
-
All Views: Deletes all tabs.
-
All Other Views: Deletes all tabs except the one you opened the menu from.
Move Tab:
-
Left (Alt + ←)
-
First (Ctrl + Alt + ←)
-
Right (Alt + →)
-
Last (Ctrl + Alt + →)
Insert Tab:
Export as Image: Exports the selected tab as image. You must specify the location and file format.
Copy to Clipboard: Copies the selected tab as BMP, PDF or META file to the clipboard.
Export View Configuration: Exports the configurations of the current visualization tab to a JSON file.
Import View Configuration (Overwrite): Imports the configurations of a visualization tab from a JSON file. Overwrites the current tab.
Element Menu
Click
to open the element menu.
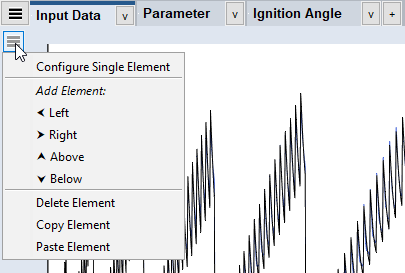
Configure Single Element: Opens the Element Configuration window.
Add Element: Adds an element to the left, right, above or below the selected.
Delete Element: Deletes the selected element.
Copy Element: Copies the element to the clipboard.
Paste Element: Pastes the element into the view.
Element Sizing
In either mode, the elements can be resized by dragging the borders. You can also change the size of the elements in the View area of the configuration mode.
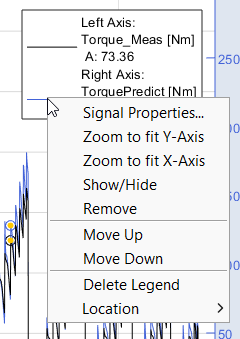
Data Point Context Menu
Right-click a data point to open its context menu. The context menu displays details about the data point. For selected data points, you can see in which tab they are selected. Click it to jump to that tab. In the example the data point is selected in the Ignition Angle tab.
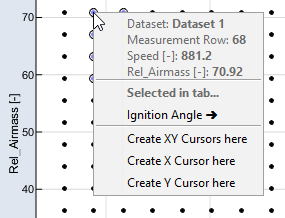
Select Create XY Cursors here to create intersecting X and Y cursors at this point.
Select Create X/Y Cursor here to create an X or Y cursor at this point.
Selection Context Menu
Right-click the border of a selection to open its context menu.
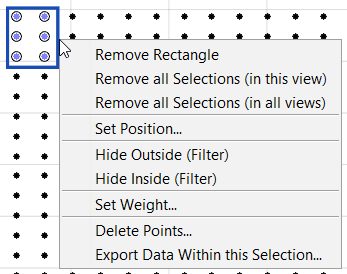
Delete Rectangle/Lasso: Deletes the selection.
Remove all Selections (in this view): Removes all selections in the view from which you opened the context menu.
Remove all Selections (in all views): Removes all selections form all views.
Set Position: Opens the Create Rectangle window where you can set the limits of the rectangle via input fields.
Hide Outside/Inside (Filter): Opens the Filter Data window with the Formula Filter prefilled. See also Filtering Data.
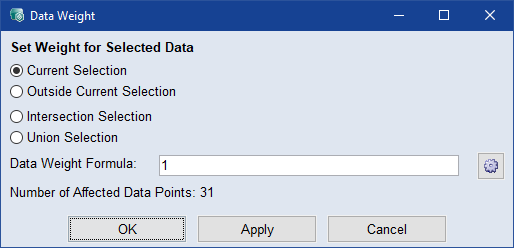
Set Weight: Opens the Data Weight window.
Delete Points: Use to delete data points inside or outside the current selection, the intersection, or the union of multiple selections. The number of data points affected is also displayed.
Export Data Within this Selection: Use to export the selected data or the intersection of multiple selections to one or multiple files. You can also select the file type.
Signal Plot Context Menu
Right-click the white space in a signal plot to open its context menu.
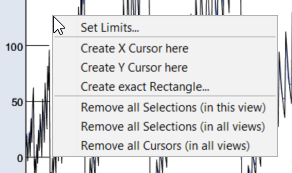
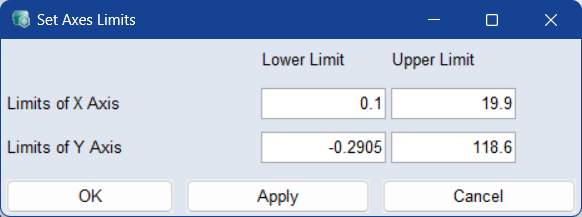
Set Limits: Opens the Set Axes Limits window, where you can set the upper and lower limits of the X, Y1, and Y2 axes to the exact values.
Select Create X/Y Cursor here to create an X or Y cursor at this point.
Create Exact Rectangle: Opens the Create Rectangle window, where you can set the exact position of a new rectangle selection.
Remove all Selections (in this view): Removes all selections in the view from which you opened the context menu.
Remove all Selections (in all views): Removes all selections form all views.
Remove all Cursors (in all views): Removes all cursors from all views.
Parameter Plot Context Menu
Right-click a parameter plot to open its context menu.
Copy to Reference: Copies the parameter data to the reference data set.
Revert to Reference: Reverts the parameter data to the reference data set.
You can also find these entries in the context menu of a parameter table.
Cursor Context Menu
Right-click a cursor to open its context menu.
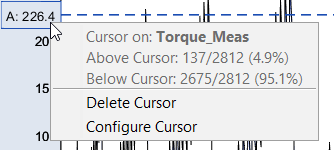
The percentage of data points above and below the cursor are displayed in the meta data section.
Delete Cursor: Deletes the cursor.
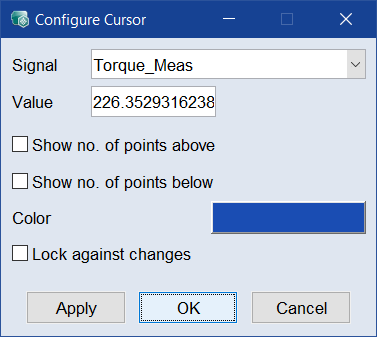
Configure Cursor: Opens the Configure Cursor window, where you can select the cursor Signal, its exact Value, and its Color. Activate the Show no. of points above/below checkbox to display the number and percentage of points above/below the cursor.
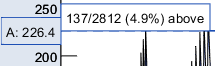
To prevent the cursor from being changed, select the Lock against changes checkbox.
Legend (as Table) Context Menu
Right-click a legend (as table)to open its context menu.
Signal Properties: Lets you edit the plot properties of the signal from which you opened the context menu. The selected signal is highlighted in the plot. For more information, see Element Configuration window.
Zoom to Fit Y-Axis: The Y-axis range is automatically adjusted to the minimum and maximum values of all selected signals within the currently visible range of the X-axis.
Zoom to Fit X-Axis: Adjusts the view to displaythe whole (time) X-Axis range of the selected signals/datasets.
Show/Hide: Shows/hides the selected signal in the plot. To show/hide multiple signals, select the signals in the legend as table view, then click Show/Hide (Ctrl + H).
Remove: Removes the selected signal(s) from the plot.
Move Up/Down: Moves the selected signal up or down in the list, which also represents its layer order in the plot, with the first signal in the list being displayed as the top layer in the graph.
Delete Legend: Temporarily hides the legend. It will be visible again when the visualization is reopened.
Location: Select the location of the legend from several options. Best finds a place in the plot with the most space.
Mode
Switch between two modes within each visualization tab.

 View
View
Switches to the view mode, where plots and texts are shown according to the view settings.
The view menu contains the following options:
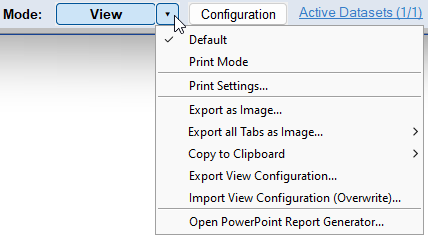
Default: Switches to normal view mode.
Print Mode: Switches to print mode, i.e. current print settings are applied and displayed.
Print Settings: Opens the Print Settings window where you can set different print settings such as font size and line width, as well as export settings. These settings apply to all visualization tabs.
Export as Image: Exports the selected tab as image. You must specify the location and file format.
Export all Tabs as Image: Exports all tabs separately to the selected file format. You must specify the location.
Copy to Clipboard: Copies the selected tab as BMP, PDF or META file to the clipboard.
Export View Configuration: Exports the configurations of the current visualization tab to a JSON file.
Import View Configuration (Overwrite): Imports the configurations of a visualization tab from a JSON file. Overwrites the current tab.
Open PowerPoint Report Generator: Opens the Report Generator window, where you can create PowePoint reports filled with visualization elements.
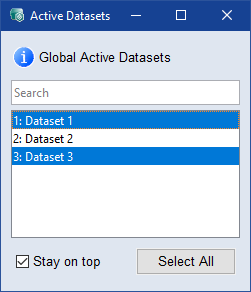
Active Datasets
Displays the number of active datasets of the total number of datasets.
Opens the Active Datasets window where you can select which datasets to activate. Activating/deactivating datasets has a global effect on all steps and dataset selection options in ASCMO-MOCA.
Select/Deselect datasets in the list to activate/deactivate them. The selection updates evaluations throughout ASCMO-MOCA live. You can use the standard Ctrl/Shift selection functions in the table.
Each dataset is assigned an ID number. This numeric identifier remains globally associated with the dataset.
|
Note |
|---|
|
The activation/deactivation of datasets is global and also affects optimization. |
Configuration
Switches to the configuration mode. Here you can configure the view settings for all elements. Switch to view mode to see the result. For a detailed description of the available settings, see Element Configuration window.
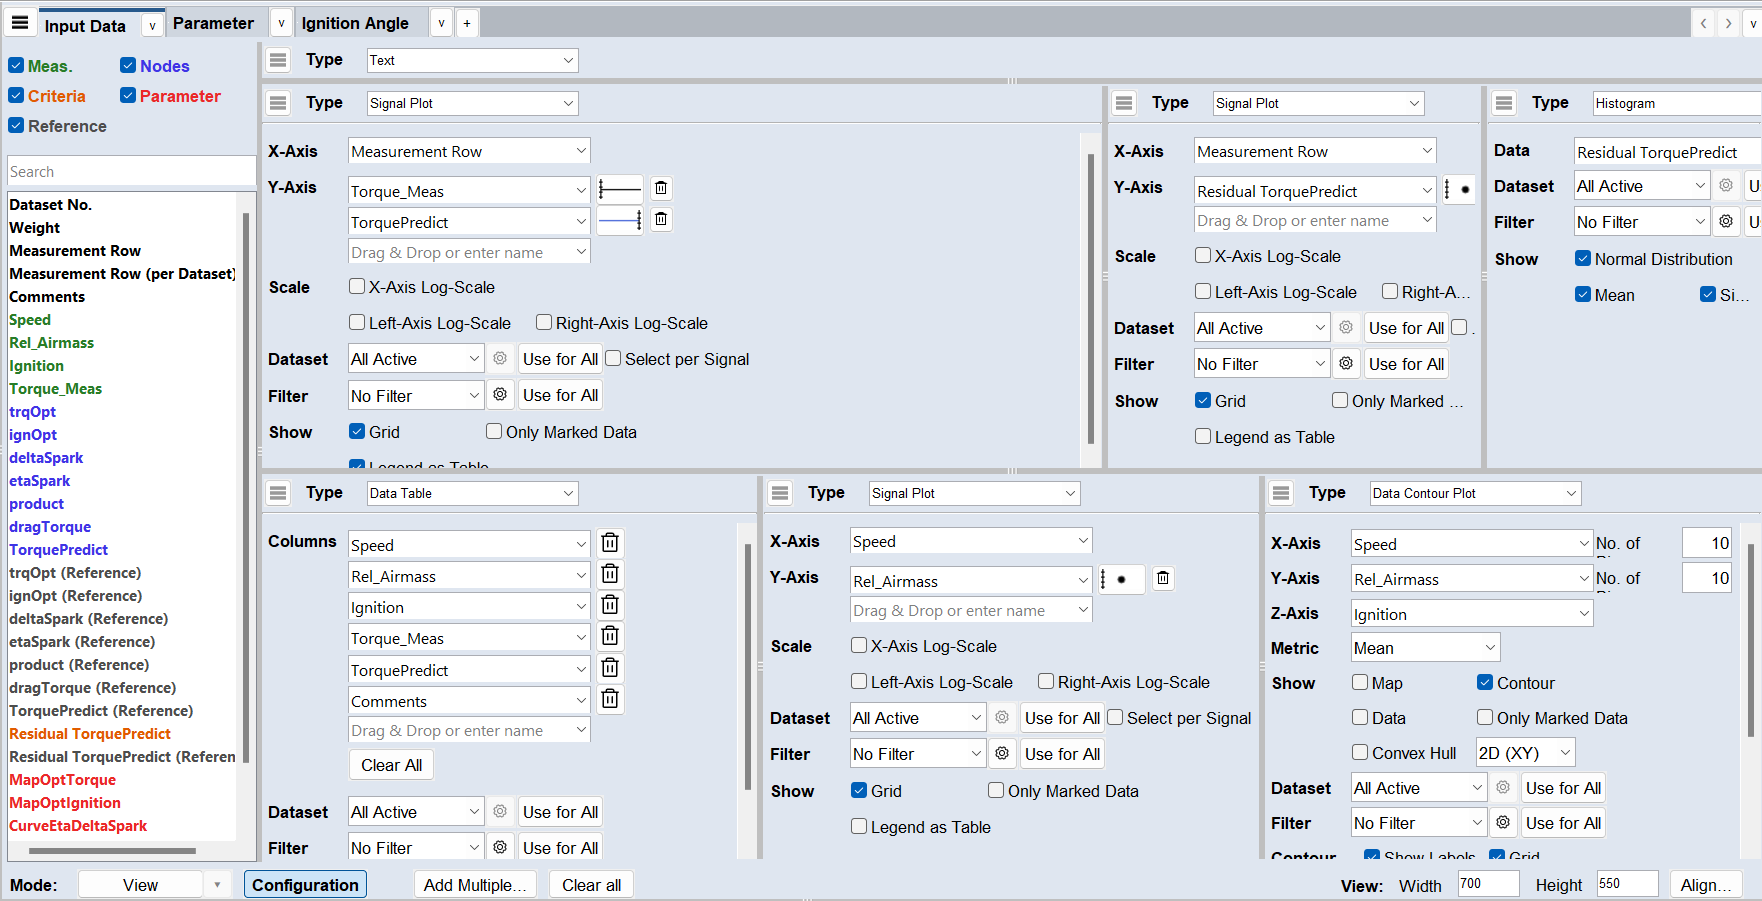
The configuration mode contains the following options:

Add multiple
Opens the Add Multiple Elements window. Here you can specify how many elements are added next to each other (Number of rows), above each other (Number of columns), their minimal height and width of the elements, as well as their position corresponding to the existing elements.
The default type of the elements to be added are empty plots. To select a specific plot type, click  .
.
Clear all
Deletes all elements of the selected view tab.
View: Width/Height
Enter the minimum size (in pixels) for the entire view. If the window is smaller than this size, scroll bars will appear. To create a view larger than the screen, enter values exceeding the screen resolution.
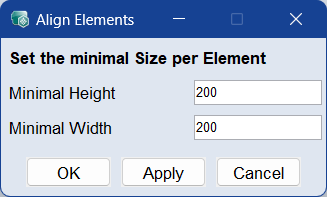
Align
Opens the Align Elements window where you can specify a minimal height and width for all elements.