Displaying the Measurement Data
To check the training data again prior to the import, it is possible to graphically display the measuring data. Proceed as follows:
-
In the "ASCMO Data Import" window, "Available Data" list, select one or more variables.
-
Do one of the following:
-
Click on Plot Selected.
-
Open the Extras menu and select Plot Selected.
A window opens which displays the following (depending on the number of selected variables):
-
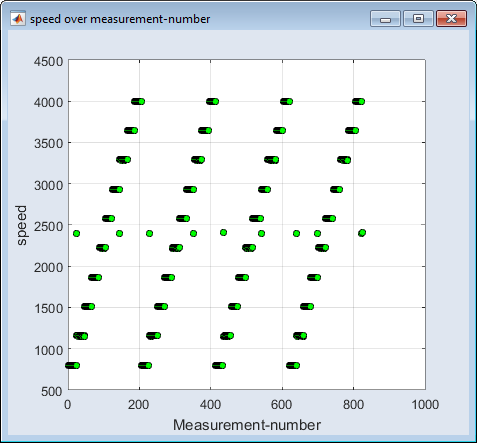
1 selected variable: measured data over number of measurement (e.g.,
 speed over number)
 -
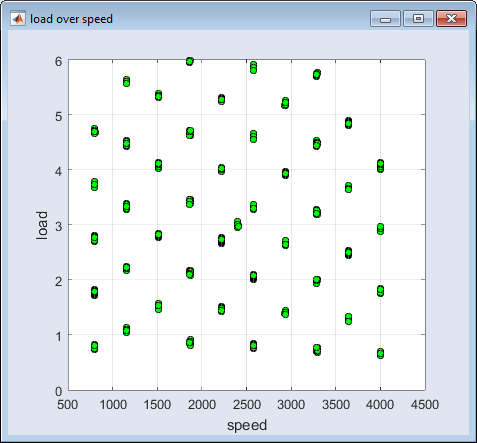
2 selected variables: data of one variable over data of the other variable (e.g.,
load over speed) -
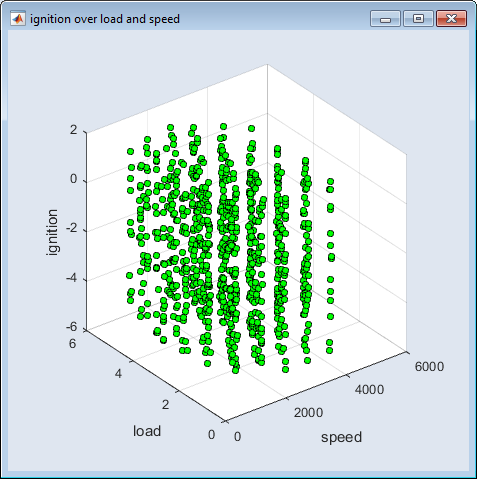
3 selected variables: data of the third column above the plane set up by the other two (e.g.,
fuel_pressure over the speed-load plane). -
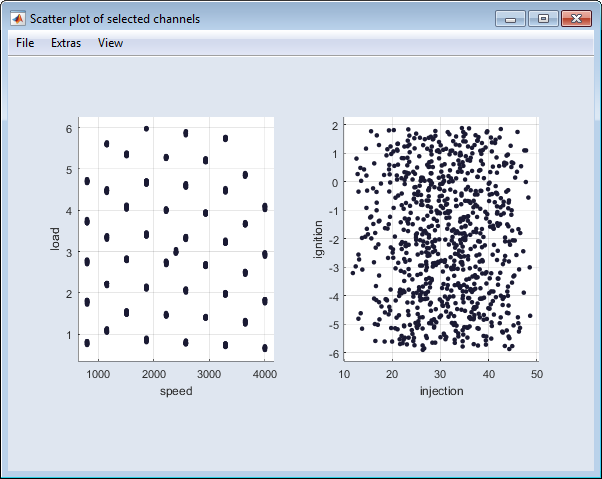
4 or more selected variables:
a series of scatter plots
-
-
Use this window to check the plausibility of the data.
See also
Assigning Inputs and Outputs (ASCMO-STATIC)