Delta Bar Chart
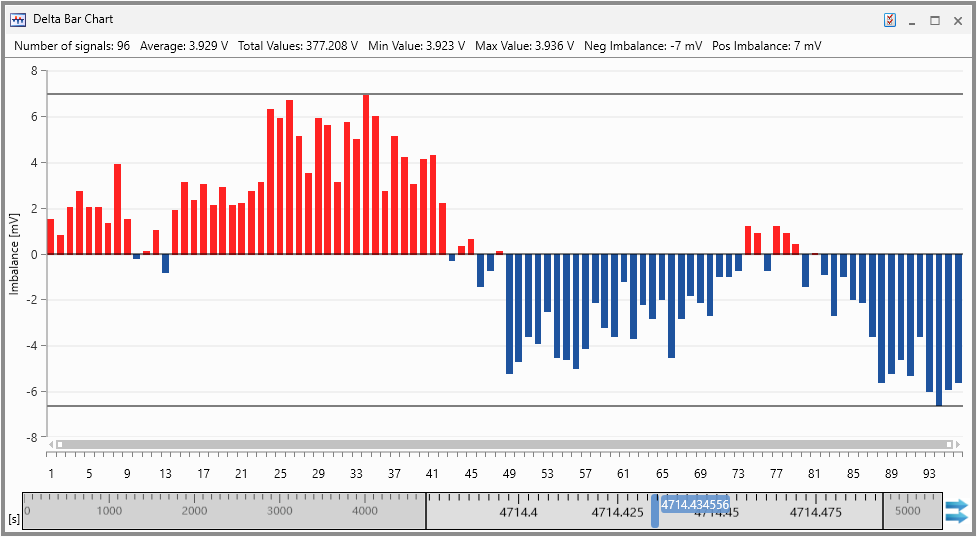
The Delta Bar Chart instrument provides a quick overview of the deviation from the average value of many signals in parallel. The deviation of each signal is shown as vertical bar wherein the zero line represents the average of all signal values for the defined point in time. Additional auxiliary lines for the minimum and maximum deviation are displayed to facilitate the overview.
You can perform the following actions:
To define the Delta Bar Chart properties
The complete set of configuration possibilities for this instrument is available in the Properties docking window. There, the tooltips provide a detailed description of the properties and their possible options.
-
Do one of the following:
-
In the instrument, click
 .
.or
-
Select the instrument and press Alt+Enter.
or
-
In the instrument, right-click and select Properties in the context menu.
-
 Selecting Signals.
To know how you can add signals to a new or existing instrument, see Assigning Signals to Instruments.
Note: Each signal can be added only once.
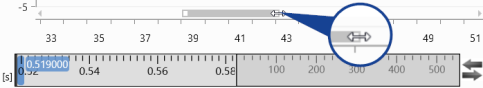
To enlarge the view for some adjacent imbalance columns, do the following:
-
Grab the left or right end of the scrollbar below the imbalance columns and drag the end towards the centre of the scrollbar.
-
In zoomed mode, you can scroll the bar to view other adjacent cells.
-
Double-click the end of the scroll bar to return it to the maximum position.
To view meta information for a particular column, simply move the mouse over it. The tooltip shows more details such as the position ID, the imbalance value, the signal name, and its measure file.
-
Right-click the signal bar, if you want to delete a signal.
-
Select Remove Signal(s).
-
Only one signal can be deleted in this way. To remove multiple signals open the Configuration Manager, multi-select the undesired signals and delete these.
See also