Absolute Value Bar Chart
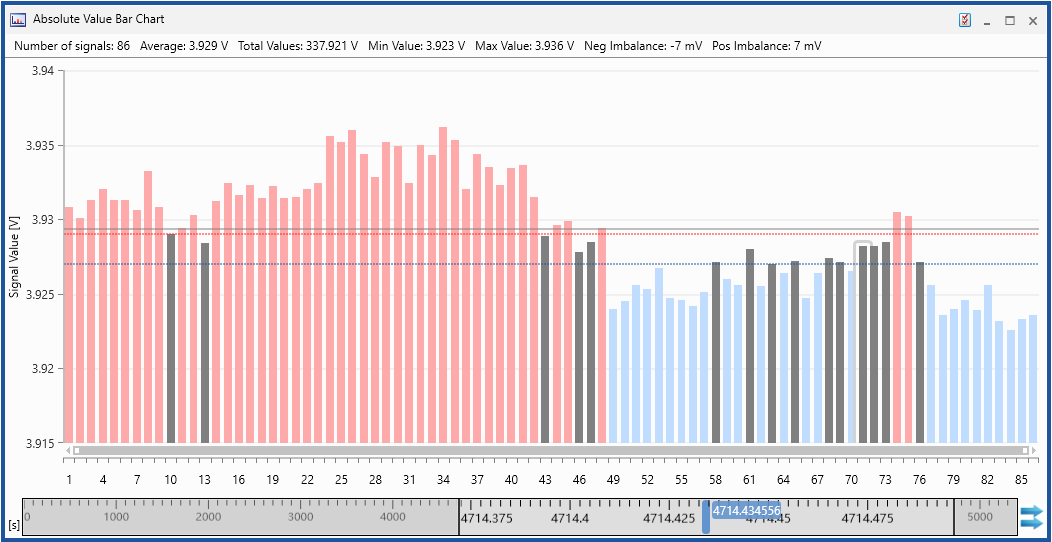
The Absolute Value Bar Chart allows you to get an overview of the signal values and and to identify the signals which exceed a lower or upper limit at the given point in time.
Each signal value is represented by a vertical bar. The signals are sorted alphabetically by the signal names.
Signal values
The graph shows the signal values of all signals as vertical bars. The height of each bar represents the value of the specific signal. Signals with a value exceeding the lower or upper limit are highlighted.
|
Bar color |
Description |
|---|---|
|
|
Signals exceeding the lower limit |
|
|
Signals within the limits |
|
|
Signals exceeding the upper limit |


Limits
Upper and lower limits are shown as horizontal lines.
| Line color |
Description |
|---|---|
|
|
Upper limit |
|
|
Lower limit |
You can perform the following actions:
To define the Absolute Value Bar Chart properties
The complete set of configuration possibilities for this instrument is available in the Properties docking window. There, the tooltips provide a detailed description of the properties and their possible options.
-
Do one of the following:
-
In the instrument, click
 .
.or
-
Select the instrument and press Alt+Enter.
or
-
In the instrument, right-click and select Properties in the context menu.
-
 Selecting Signals.
To know how you can add signals to a new or existing instrument, see Assigning Signals to Instruments.
Note: Each signal can be added only once.
For more information, see To replace a signal.
-
Right-click the row with the signal that you want to delete.
-
Select Remove Signal(s).
-
Only one signal can be deleted in this way. To remove multiple signals open the Configuration Manager, multi-select the undesired signals and delete these.
See also