Timeplot
Chart type that has time as x axis. It plots the signal values on the y axis in dependance on the time when the signal values were measured.
A timeplot requires a considerable amount of memory since a potentially huge amount of data points is stored. It is not recommended to use this chart type for a big measurement set. EATB focuses on extracting the relevant information and hence reducing the original data set. If no prior information is available, MDA can be used to investigate single measurement files and define which analysis should be performed.
You must provide a quantity value for the time axis. It is recommended to set the quantity as a multiple of the grid. For example, if grid = 0.003, then set quantity = 3.0. For more information about quantity and grid, see Calculation Details.
Display Types
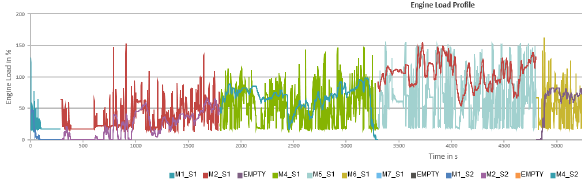
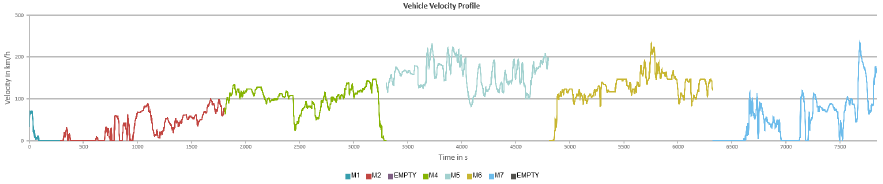
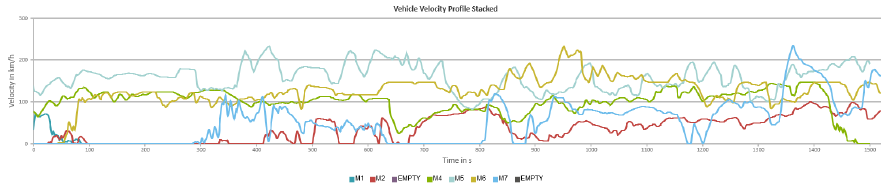
The x axis is the time axis. The y axis shows the signal values. If the display type is "stack", the first sample of every measurements starts with 1.
If there is more than one excerpt in a timeplot, you can select from two display types:
-
time: Different excerpts displayed in sequence
-
stack: Different excerpts displayed one above the other
Video Support
If you have used an environmental camera during measurement recordings, the closest available video information can be shown per timestamp as a screenshot in the tooltip. If multiple videos are available multiple video streams are shown next to each other.
You can enable the video support for timeplots, intervals, and GPS maps. Note that you can only enable videos within the EATB APIs.