GPS Map
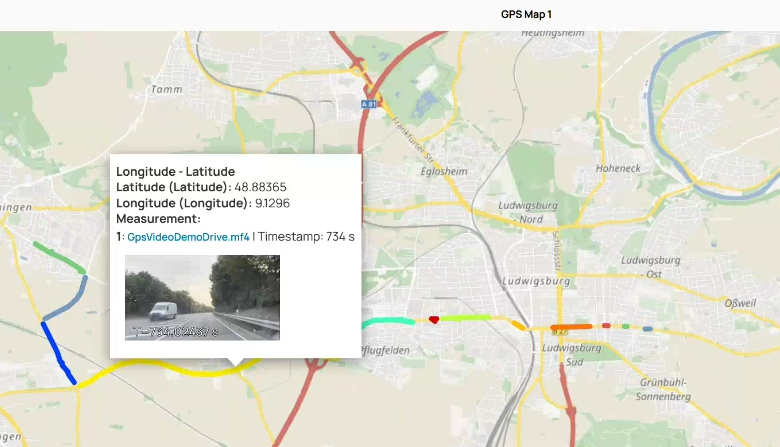
Chart type that displays GPS data on an interactive map. Additionally to the longitude and latitude, you can define a third value to visualize how this value changed within the drive. This third value can either be shown as continuous or discrete color gradient. For more information, see Assigning Signals to the GPS Map.
| Continuous color gradient | Discrete color gradient |
|
|
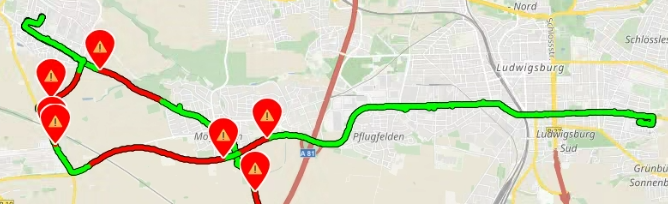
With EATB Worker Python, you can additionally set event markers. For more information, see the "Python Scripting Guide" by clicking  .
.
If you have used an environmental camera during measurement recordings, the closest available video information can be shown per timestamp as a screenshot in the tooltip. If multiple videos are available multiple video streams are shown next to each other.
You can enable the video support for timeplots, intervals, and GPS maps. Note that you can only enable videos within the EATB APIs.