Discrete Histogram
Bar chart that shows the frequency of individual, distinct values in a dataset, rather than grouping them into continuous ranges like a Histogram.
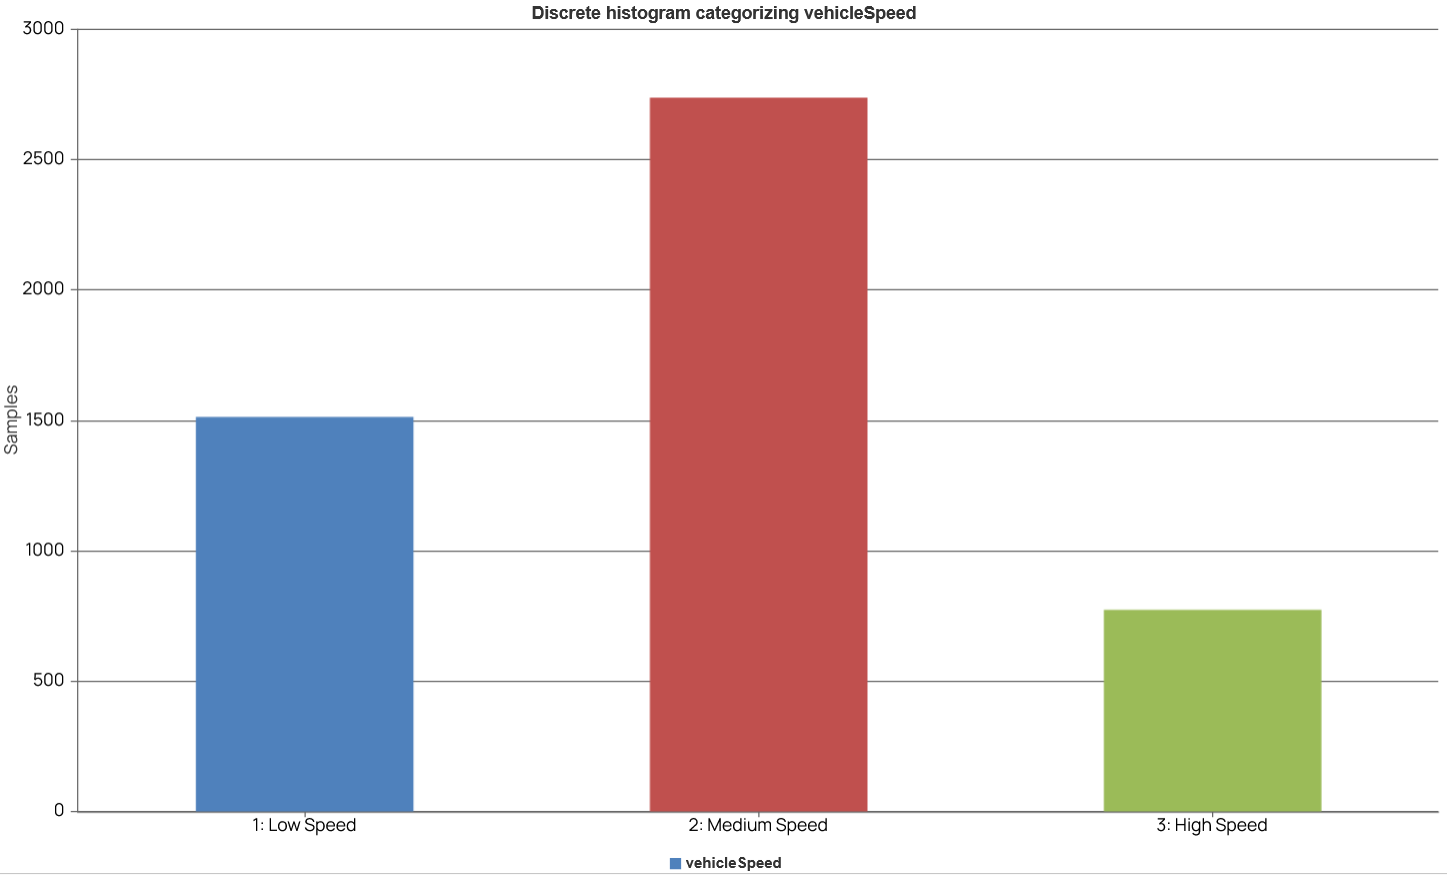
The discrete histogram below displays the distribution of vehicle speed data, categorized into three distinct levels: "1: Low Speed," "2: Medium Speed," and "3: High Speed." The y-axis, labeled "Samples," indicates the count for each category.