Histogram
Chart type that represents frequency distributions of certain events or values.
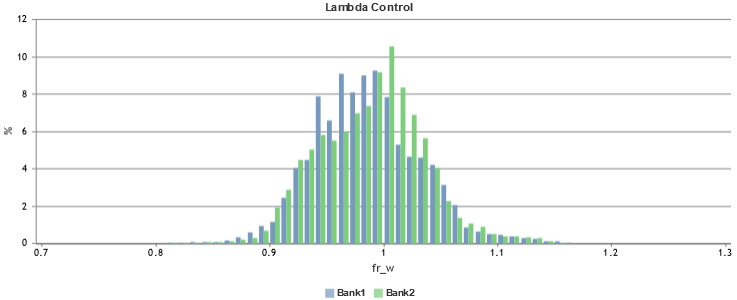
Only one signal is allowed as input for the x axis. The y axis can be modified by using display types.
Display Types
-
value (default):
Representation of the frequency distribution of a value in absolute number
-
percent:
Representation of the frequency distribution of a value in percent
-
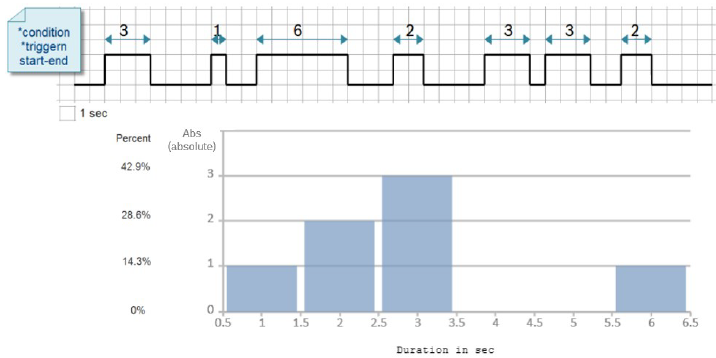
durationAbs:
Overview of the duration of a value in absolute number; you must specify at least one condition or two triggers (start+end), otherwise you get the view of value / percent.
-
durationPercent:
Overview of the duration of a defined event shown relative to the data samples selected by the intervals. You must specify at least one condition or two triggers (start+end), otherwise you get the view of value / percent.
Example:
-
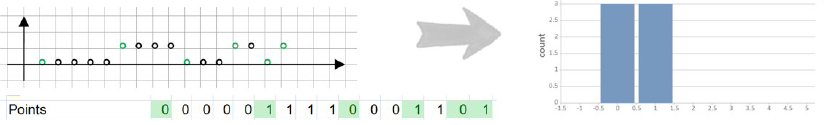
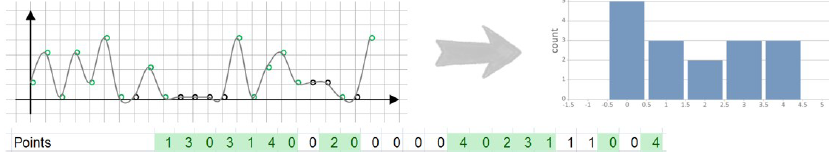
steps:
Number of times each value was observed. Continuous segments where the value is consistently present are only counted once.
Example 1:
Example 2:
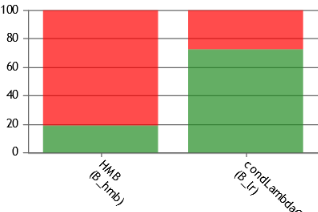
-
bar (for bit signals only):
Frequency of states to evaluate multiple bit signals; no quantity and range need to be set.
In the generated report, you can switch the display type again.
|
Note |
|
A subtype of the histogram is "histpie" that represents the data as proportions of a circle. |