EATB Report
The EATB Report allows you to display background information about each display object or hide several data series. Additionally, the traffic light system used to signalize the violation of predefined thresholds helps you to perform a quick validation of the generated display objects.
|
No. |
Description |
|
|---|---|---|
|
|
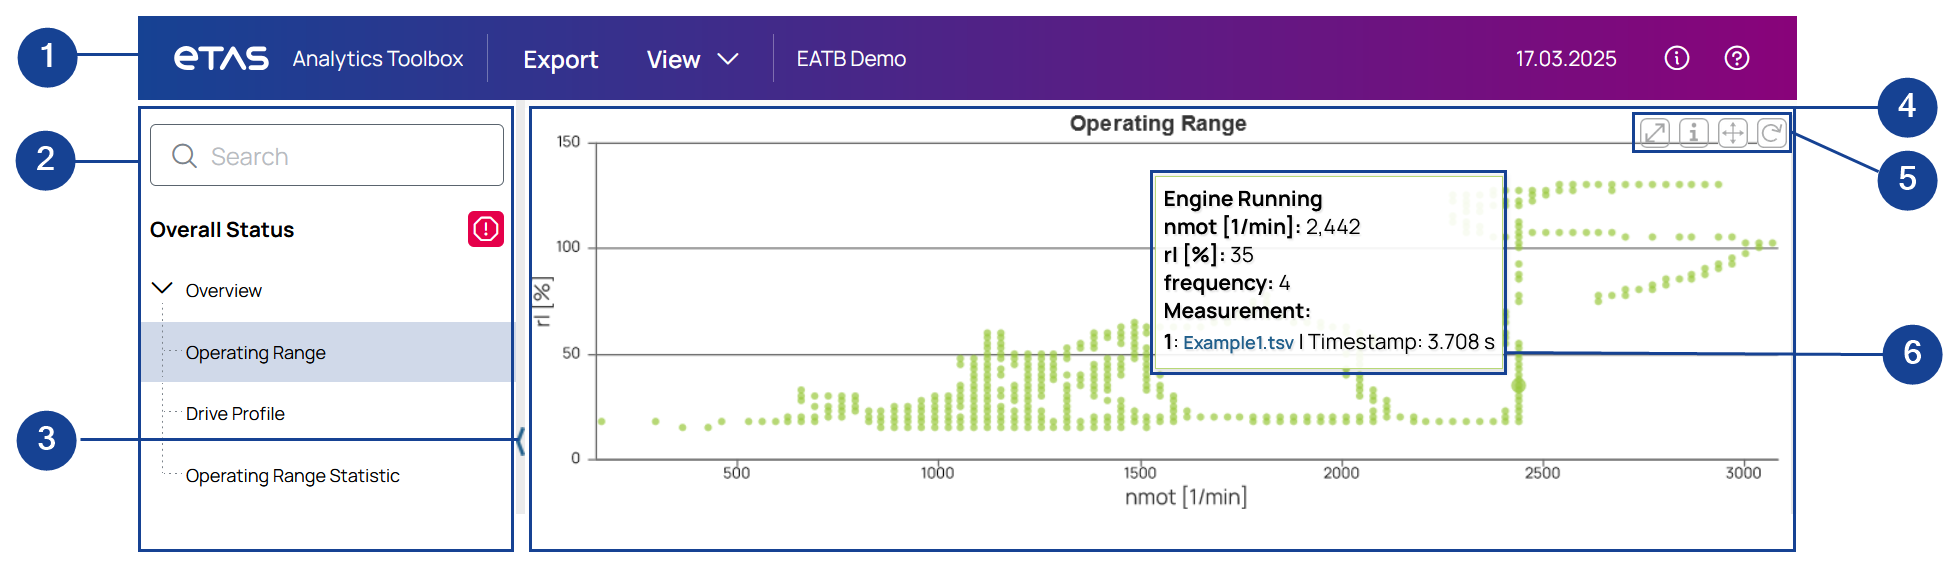
Toolbar: Get general information about the complete report, export the complete report, or adjust the settings for all display objects in the report. |
|
|
|
Search and tree view: Expand or collapse the structure elements of the report. For more information, see Report Structure. |
|
|
|
Sidebar arrow: Close or open the sidebar view. |
|
|
|
Main window: Get detailed information about each display object. |
|
|
|
Options for display object: |
|
|
|
Open the display object in full screen mode. By using the arrow icon in the right bottom corner of the full screen mode, you can navigate to the next display object. |
|
|
|
Show information about the selected display object. |
|
|
|
Visible only if you have zoomed into the chart before. You can switch between zoom and scroll mode. You always see the button for the mode you are currently not using. For more information, see Zooming and Scrolling. |
|
|
|
Visible only if you have zoomed into the chart before. You can reset the chart to the initial view. |
|
|
|
Tooltip: Get sample-specific information by hovering the mouse over a chart. For more information, see Using the Tooltip. |
|


See also: