Zooming and Scrolling
You can define a zoom area and synchronize the zooming with other charts. Zooming is possible for the following chart types: plot, scatter, histogram, interval, and timeplot.
- Click into the chart that you want to zoom and keep the left mouse button pressed.
-
Move the mouse cursor.
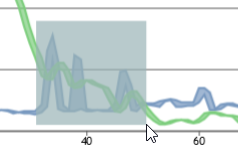
A gray rectangle indicates the zoom area.
-
Release the mouse button.
The defined area is shown in the chart.
- To show the complete chart again, click
 .
.
To synchronize zooming
-
To zoom into several charts simultaneously, you can synchronize the zooming. Right-click a chart and select Zoom-Synchronisation from the context menu.
-
In the Configure synchronised charts window, search for the chart that you want to synchronize.
As soon as you enter your search string a list with possible matches is shown.
- Select the chart from the list.
- If you want to add more charts, repeat step 3.
- Click Save.
-
Perform the zooming as described in To zoom.
- To stop the synchronization, open the Configure synchronised charts window again as described in step 1 and remove the synchronized charts from the list.
To scroll in the zoomed view
-
To scroll along the axes in zoomed view, you must switch to the scroll mode. In the upper right corner of the chart, click
 .
.The symbol of the mouse pointer changes.
-
Click into the chart and keep the left mouse button pressed while moving the mouse along the axes.
The chart is scrolled according to your mouse movement.
- To switch back to the zoom mode, click
 .
.