Defining the Report Structure and Display Objects
To create a report, configurations are needed. Configurations allow you to specify all display objects, i.e., charts and tables, to be visualized.
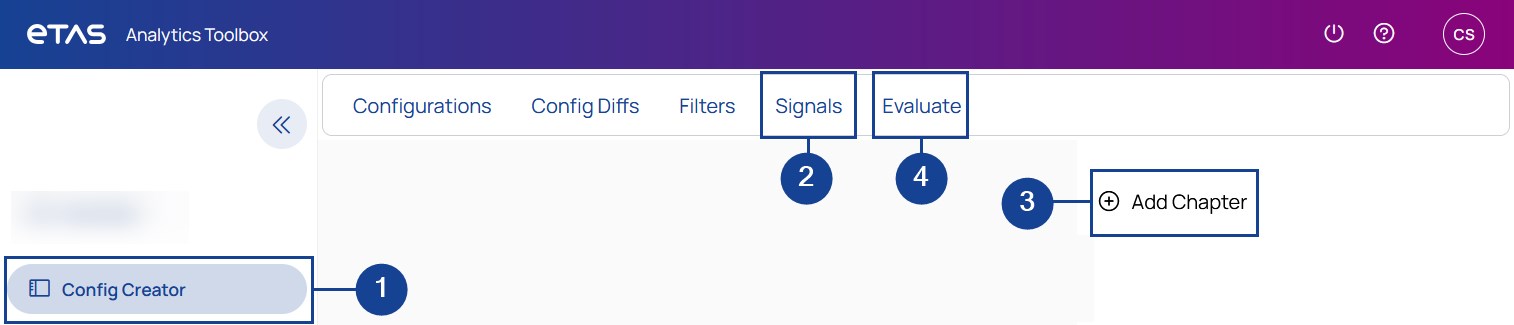
In EATB GUI, these are the basic steps to create your first configuration:
- In EATB GUI, click Config Creator.
-
To import signal labels, click Signals.
You can choose to load the signals from measurements or LAB files. After the loading is done, all signals are displayed. For more information, see Importing Signals.
-
In the Configuration Creator, define your report structure:
-
Click Add Chapter.
-
Click Add Section.
-
Click Add Chart (see also Adding Display Objects).
-
Depending on the display object, assign one or more signals to it (see also Assigning Signals).
-
Set additional properties. For example, you can set thresholds for signals in a chart (see also Setting Thresholds).
-
-
To start the new evaluation, click Evaluate.
EATB switches to New Report.
Is your configuration ready? – Then, continue with Creating a New ReportQuickly.