Visualizing the Dynamic Experimental Plan
To be able to evaluate the plan data, you can display it either graphically or as a table at any time.
For the execution of the tutorial, section Visualizing the Dynamic Experimental Plan , is not absolutely necessary. You can directly continue with Step 2: Constraints .
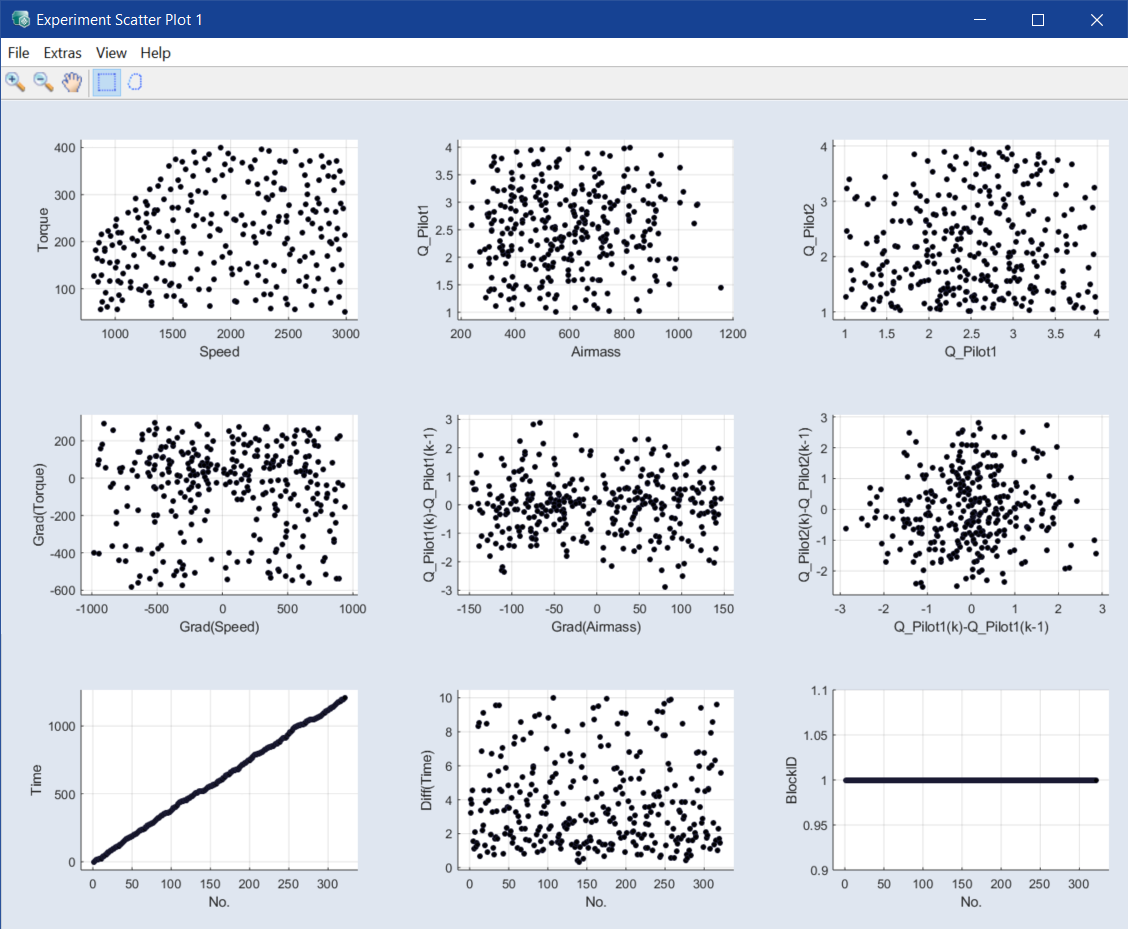
Visualizing the experiment plan in a scatter plot
-
In the ASCMO-DYNAMIC ExpeDes main window, select View > Scatter Plot to show 2-dimensional representations of the experiment plan.
-
In the Experiment Scatter Plot window, select the axes you want to show with View > Select Axes.
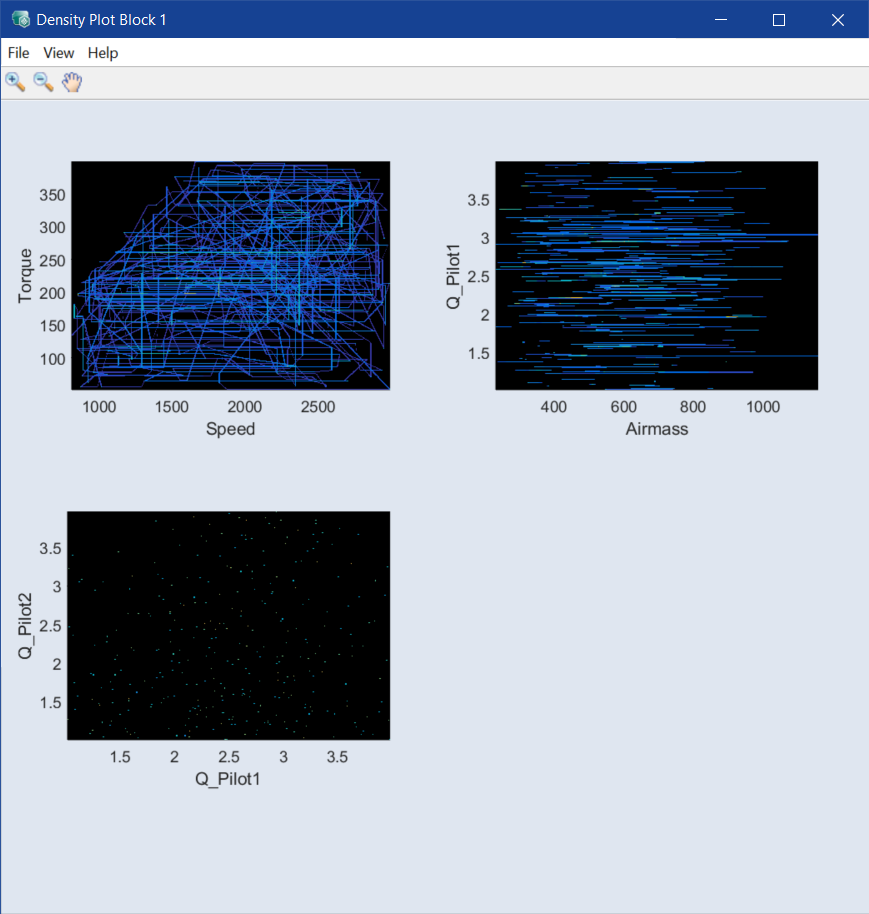
Visualizing the experiment plan in a Density Plot
A density plot visualizes the dynamic of the experiment plan by showing the trajectories of the plan. With the lightness graduation of the trajectories, you can see the frequency of stay on the different points (the brighter the point is plotted, the higher is the frequency of stay in the experiment plan). The visualization is independent of the time.
-
In the ASCMO-DYNAMIC ExpeDes main window, select View > Density Plot to show density plots of the experiment plan.
-
In the Experiment Density Plot window, select the axes you want to show with View > Select Axes.
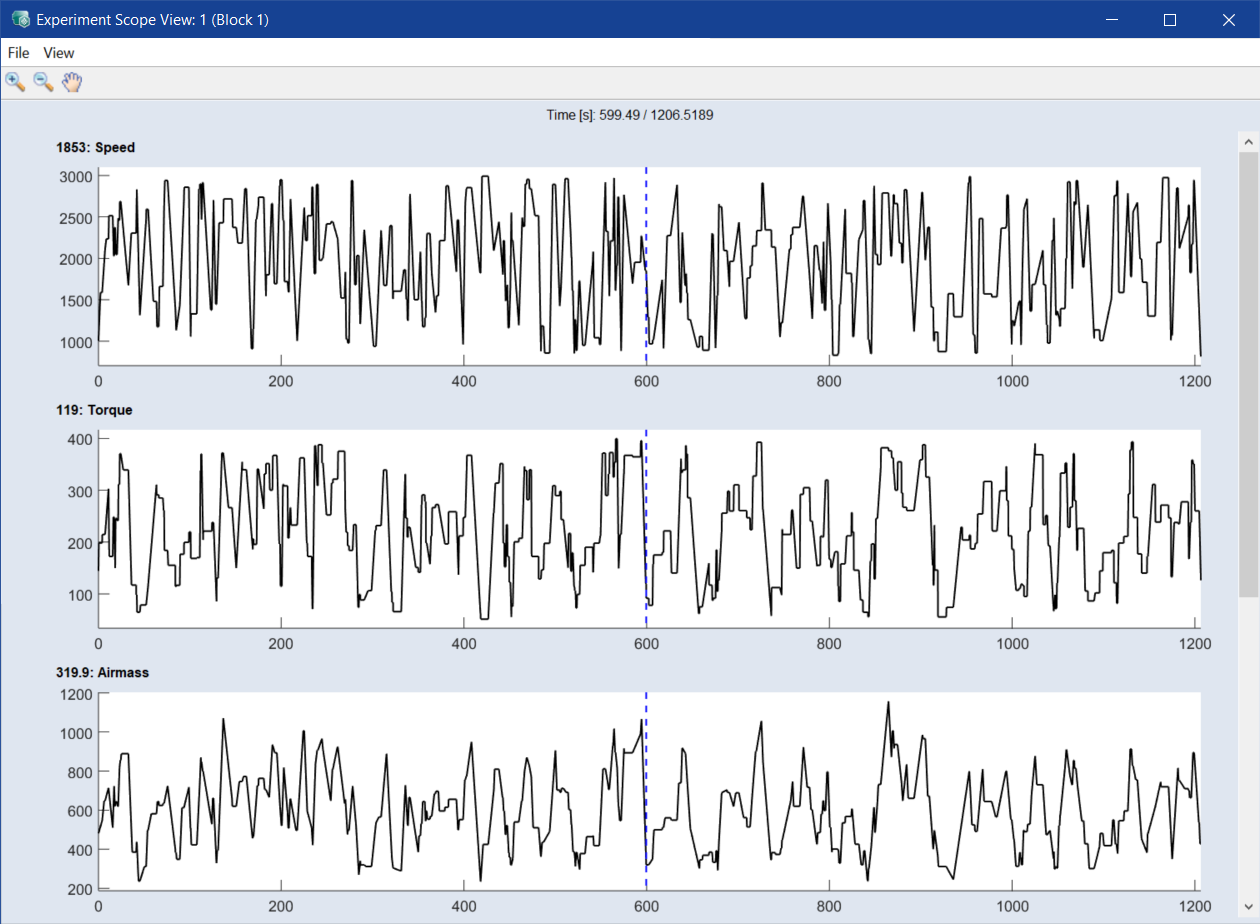
Visualizing the experiment plan in a time-based plot (Scope View)
-
In the ASCMO-DYNAMIC ExpeDes main window, select View > Scope View to show the experiment plan in a time-based plot.
|
Note |
|---|
|
If you click in the time-based plot, the time-dependent value will be displayed. If you hold down the left mouse button, you can retrieve the time-dependent.values dynamically along the time axis. |
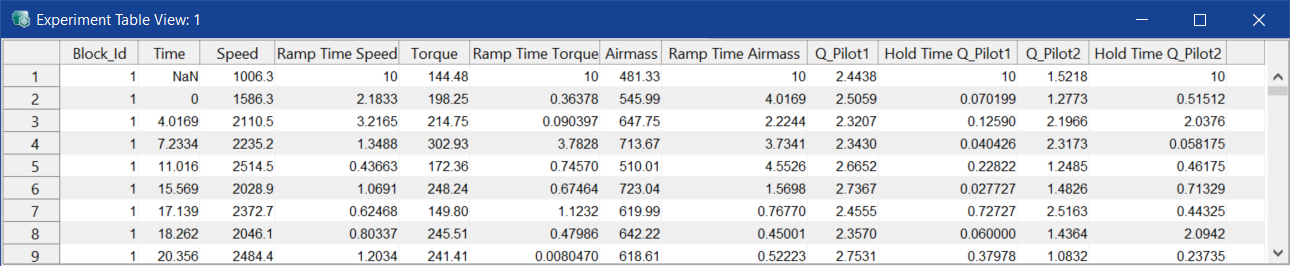
Visualizing the experiment plan in a table view
-
To show the data of the measure plan in a table, select View > Table View.