Displaying the Measured Dynamic Data
To check the training data again prior to the import, it is possible to graphically display the measuring data. Proceed as follows:
-
In the "ASCMO Data Import" window, "Available Data" list, select one or more variables.
-
Do one of the following:
-
Click on Plot Selected.
-
Open the Extras menu and select Plot Selected.
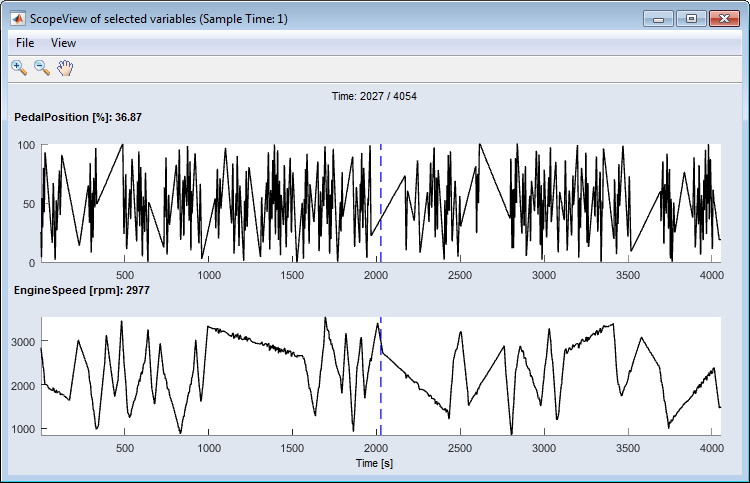
A
 "Scope View" window opens that displays the selected variables.
 -
-
Use this window to check the plausibility of the data.
-
If desired, do the following to adjust the plots.
-
In the "Scope View" window, select View → Signal Selection.
The "Scope Signal Selection" window opens. It shows the default assignment of variables to scopes.
-
In the "Scopes" list, select one or more rows and click on Remove.
The rows are deleted from the table.
-
In the "Available Signals" list, select one or more variables.
-
Do one of the following:
- Click on New Scope to assign all selected variables to a single new scope.
- Click on Multiple Scopes to assign each selected variables to a separate new scope.
- Select a scope in the "Scopes" list and click on Add to Scope to add the selected variables to an existing scope.
-
Click on OK to apply your selections.
The "Scope View" window is updated.
-
See also
Importing Measured Dynamic Data
Assigning Inputs and Outputs (ASCMO-DYNAMIC)