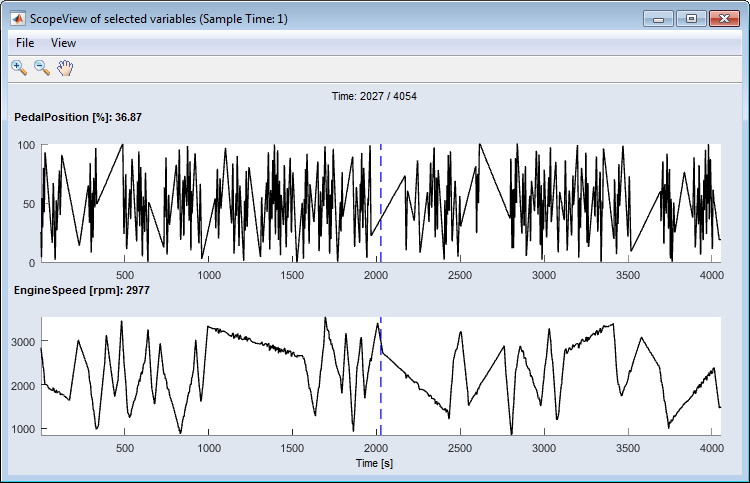
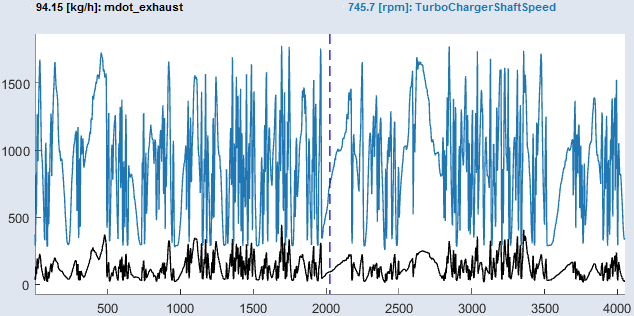
"Scope View" Window

The Closed"Scope View" window shows the selected variables versus time. If you assign several variables to one scope, each variable is plotted in a Closeddifferent color.

ClosedFile

    Close: Closes the window.

ClosedView

  • Signal Selection

    Opens the Scope Signal Selection window where you can assign the desired axes to scopes.

  • Set Time Range

    Opens the Set Time Range window where you can set the range of the time axis.

ClosedToolbar

    This table shows a selection of possible toolbar buttons.

    Zoom in

    By clicking in the plot, the visualization becomes larger.

    Zoom out

    By clicking in the plot, the visualization becomes smaller.

    Pan

    This allows you to move the plot within the window.

    Mouse selection in plot with rectangle

    Sets the selection tool in the scatter plots to a rectangle.

    Mouse selection in plot with lasso

    Sets the selection tool in the scatter plots to a lasso.

    Update

    Updates the plots in the window.

See also

Scope Signal Selection

Displaying the Measured Dynamic Data

Importing Measured Dynamic Data