Elements of the ASCMO-DYNAMIC User Interface
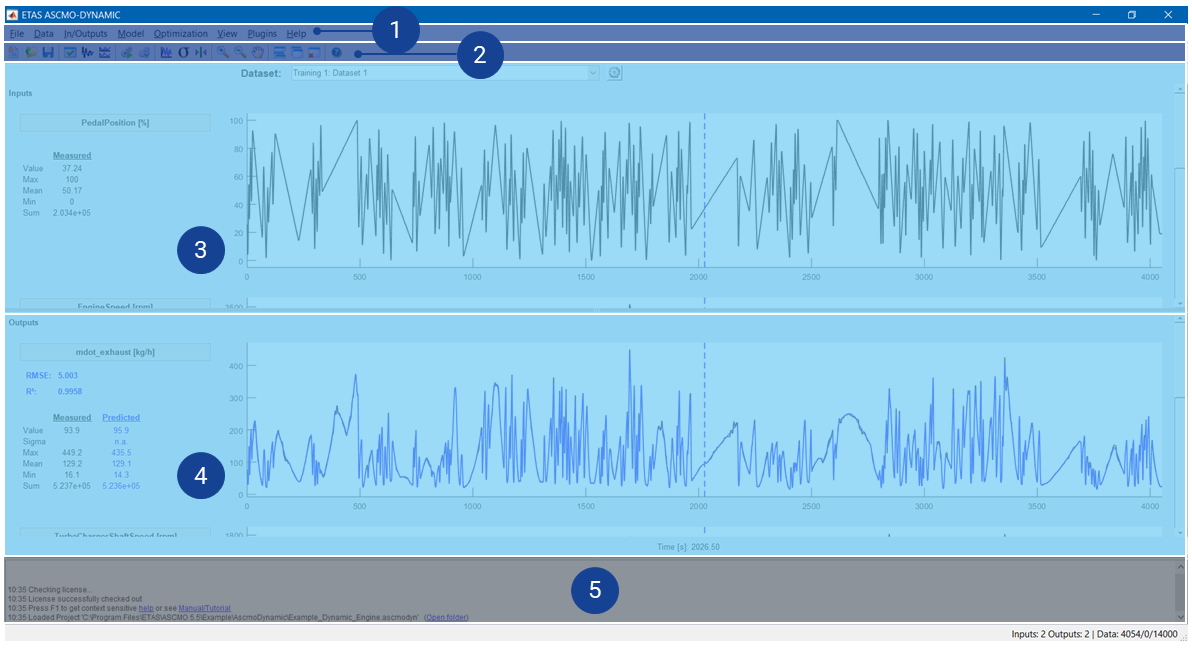
The main window of ASCMO-DYNAMIC consists of the following areas:
- ➀
- ➁
-
➂
with
 button (directly below the toolbar)
 - ➃
- ➄
- Status bar (footer) with current state information
"Data Set" Drop-down
This drop-down offers all sets of training or test data for selection. The selected dataset is displayed in the "Inputs" and "Outputs" areas.
The ![]() button opens the
button opens the
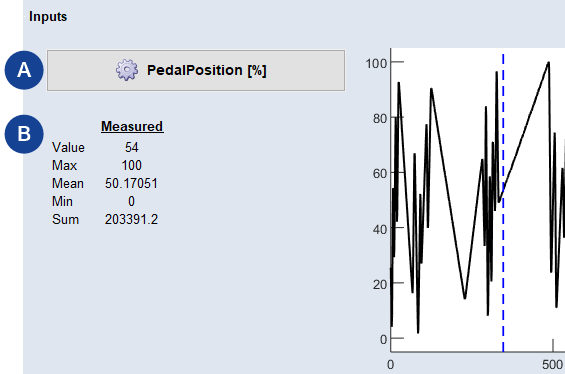
"Inputs" Area
Information on the inputs x1,..., xn is displayed on the left of the time-based plot in the upper area of the ASCMO-DYNAMIC main window.
|
Note |
|---|
|
You can hide information about the inputs by selecting View > Show * |
-
A Input name and unit
Click the button to change the name and unit.
-
B Current values of the input
-
Value: The current value at the specified position in the plot.
-
Max, Mean, Min: The maximum, mean, and minimum values of the respective input.
-
Sum: The sum of all input values.
-
If you want to display the value for another time position in the plot, click on the desired position with the cursor.
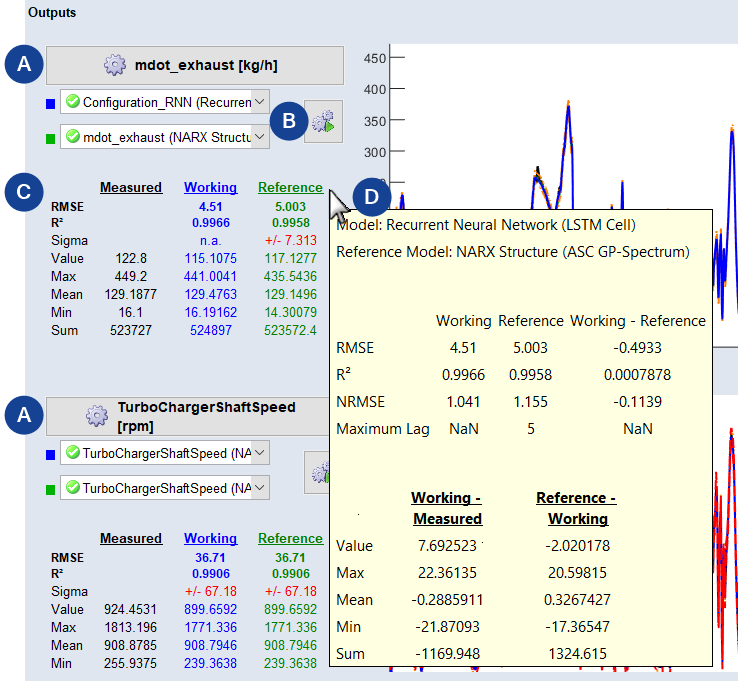
"Outputs" Area
Information on the modeled outputs is displayed on the left of the time-based plot in the lower area of the ASCMO-DYNAMIC main window.
|
Note |
|---|
|
You can hide information about the outputs by selecting View > Show * |
-
Click the button to open the
The respective model type selection for working (blue) and reference (green) can be set in the drop-down. The modeling method and the associated model type is set in the configuration of the output (Model > Configurations).
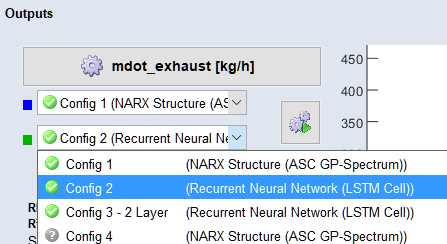
Multiple models can be trained and easily compared for a specific output. You can define several configurations for an output (Model > Configurations). Within the configuration the modeling method and model type are defined. That enables you to apply different modeling methods for an output in an easy way. Additionally, a configuration can also be reused and applied to other outputs for the working or reference model. The concept and settings will be described in detail in the upcoming online help.
-
B Model Training
Trains models with selected configurations. You can choose between working model, reference model or both.
-
C Current values of the output
-
RMSE: Displays the root mean square error.
-
R2: Displays the model's uncertainty
-
Sigma: Displays the model's uncertainty at the specified time in the plot.
-
Value: The current output value at the specified position in the plot.
-
Max, Mean, Min: The maximum, mean, and minimum values of the respective output.
-
Sum: The sum of all output values.
Note
If you have defined a model as reference model and selected in the drop-down, you can see the values of the reference model.
-
-
D Tooltip
Shows the actual values of the output and the difference between Working - Measured and Reference - Working in an overview.
If you want to display the value or the model sigma for another time position in the plot, click on the desired position with the cursor.
Log Window
In this area, notes, status messages and results (e.g. of optimization runs) are shown.