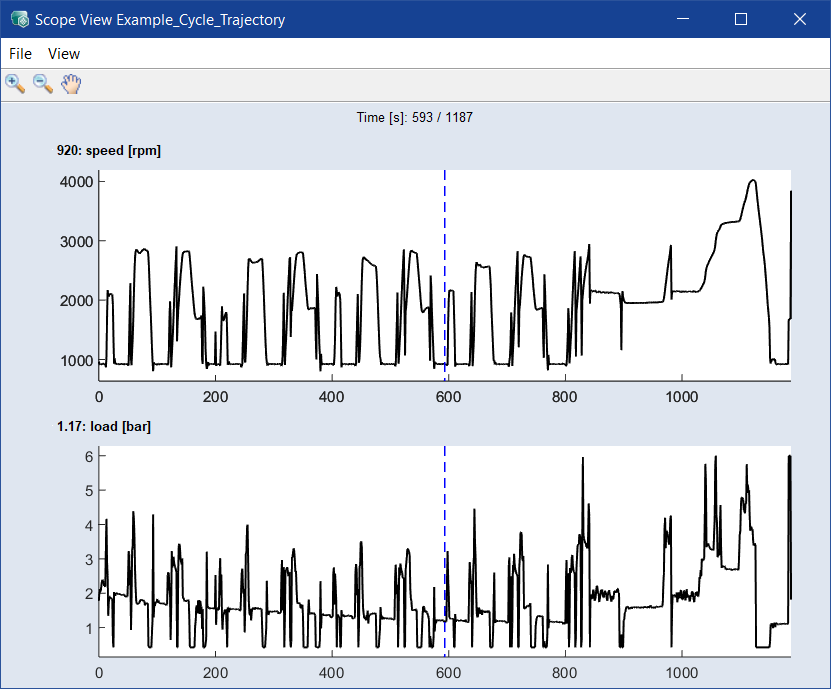
Scope View <driving cycle>
Calibration menu > Driving Cycles >  Scope View
The Scope View <driving cycle> window shows the operating point axes of the selected driving cycle versus time. If you assign several variables to one scope, each variable is plotted in a different color.
The Scope View <driving cycle> window contains the following elements:
 File
File


See also