Density Plot <driving cycle>
Calibration menu > Driving Cycles >  Density Plot
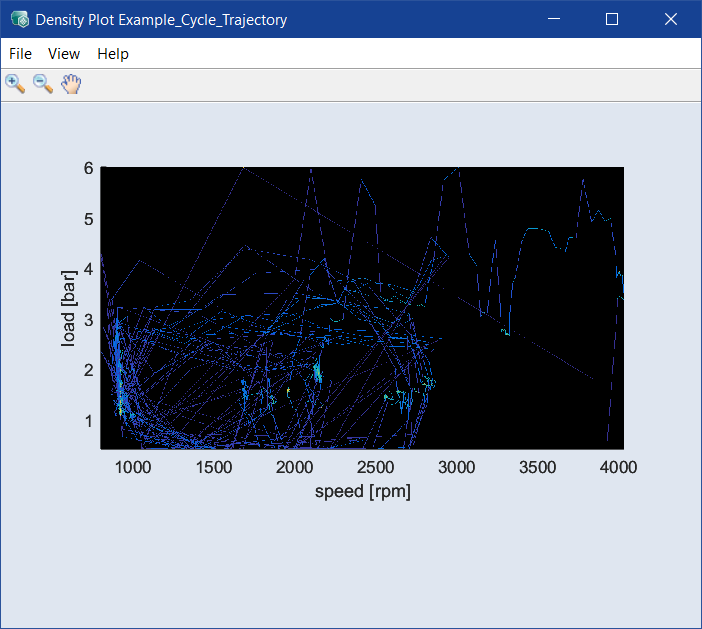
This window shows a density plot of the operating point axes of the selected driving cycles.
The Density Plot <driving cycle> window contains the following elements:
Close: Closes the window.
-
Select Axes
Opens the
-
Plot Settings
Opens the Plot Settings window where you can make the
 following settings.
-
Min Axis Width/Height
This allows you to set the minimal size of the plot in pixel. If you change the size of the Density Plot window, the individual plots will be adapted automatically until you reached your desired size. If you want to minimize more the Density Plot window, you will get scrollbars in the navigation.
Note
The axis width has to be an integer in [100 900] and the axis height has to be an integer in [100 600].
-
Fineness
Sets the fineness of the rasterized image.
Note
Available values: 0 ... 10. The lower the value is, the finer is the image.
-
Blur
A Gauss filter allows to visualize effects and to have an optimal use of the plot visualization. It is individual available for all experiment plans.
Note
If Blur is "0", you can see the period frequency of stay of the grid point.
-
White background
Creates a white background.
-
Show Colorbars
Shows the color bars.
-
-
Save as Bitmap
This allows the content of the window to be saved in a series of graphic formats.
-
Copy to Clipboard
Copies the window content to the clipboard.
-
User Guide: Opens the PDF User Guide.
-
Online Help: Opens the online help (F1).
-
Interface Help: Opens the interface help.
-
License: Opens the ETAS License Manager.
-
Support: Displays contact information for various ETAS support channels.
-
Safety Advice: Opens the ETAS safety advice.
-
About: Opens the About window, where you can also get information about OSS used in ASCMO.
This table shows a selection of possible toolbar buttons.
|
|
Zoom in |
By clicking in the plot, the visualization becomes larger. |
|
|
Zoom out |
By clicking in the plot, the visualization becomes smaller. |
|
|
Pan |
This allows you to move the plot within the window. |
|
|
Mouse selection in plot with rectangle |
Sets the selection tool in the scatter plots to a rectangle. |
|
|
Mouse selection in plot with lasso |
Sets the selection tool in the scatter plots to a lasso. |
|
|
Update |
Updates the plots in the window. |


See also