2D and 3D Visualization of Inputs and Outputs
Besides the display of the functional dependencies in the ISP view, it is also possible to display two inputs each in form of 2D plots or one output and two inputs in form of 3D plots.
2D display of two inputs
-
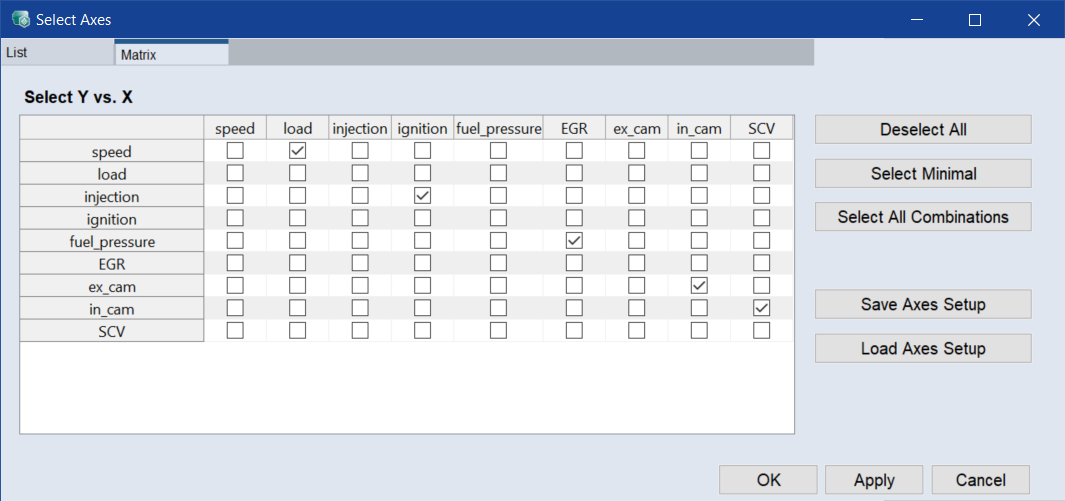
Select In/Outputs > 2D Plot Inputs.
The Select Axes window opens.
-
Go to the Matrix tab.
-
To delete the predefined selection, click Deselect All.
-
Click the checkbox in the EGR row and the speed column.
-
Click OK.
The measuring data (black points) of the exhaust-gas recirculation at different speeds are displayed in a plot window.
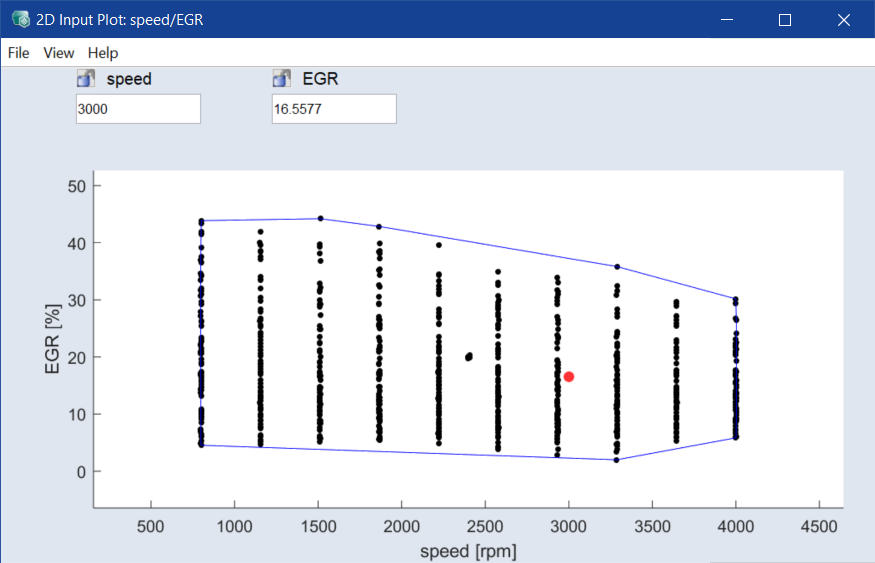
The red point represents the currently selected value of speed and EGR setting in the ISP view.
-
Click a point in the plot.
-
The red point moves to the selected position and the ISP view is updated.
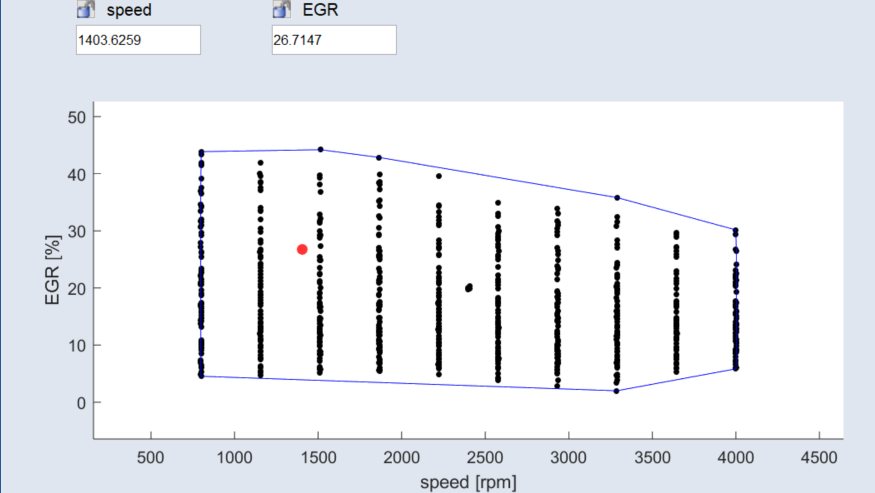
Changes in the ISP view (that apply to the values of speed or EGR) are conversely also updated in the 2D plot.
Special 2D display for operating points
A special 2D display is available for any selected operating points in case of global models. This display is named Operating Points Manager window or operating points manager. A separate display of these variables outside of the ISP view is useful since they frequently have the greatest influence on output variables, such as consumption and emissions. For this reason, the dynamics of the influence of other inputs is frequently lost in the ISP view.
-
Select In/Outputs > 2D Plot Operating Points.
The Operating Points Manager window opens.
The navigation (i.e. the selection of operating points) can now be performed in the separate window.
-
If desired, deactivate the display of the operating points in the ISP view.
-
To select a new operating point, do one of the following:
-
Click in the plot.
-
Enter the desired values in the input fields above the plot ((A) in Operating points manager (A: input fields for operating point values, B: operating points, C: measurement points, D: convex hull of the plot)).
The set operating point can be added to the operating point list via the Add OP button.
-
-
To start a single-criterion optimization after each change of an operating point, select Extras > Optimize on Move.
-
To visualize the operating points in the plot ((B) in Operating points manager (A: input fields for operating point values, B: operating points, C: measurement points, D: convex hull of the plot)), select View > Show OPs.
-
To visualize the measurement points in the plot ((C) in Operating points manager (A: input fields for operating point values, B: operating points, C: measurement points, D: convex hull of the plot)), select View > Show Measurement Points.
-
To visualize the convex hull of the plot ((D) in Operating points manager (A: input fields for operating point values, B: operating points, C: measurement points, D: convex hull of the plot)), select View > Show Convex Hull.
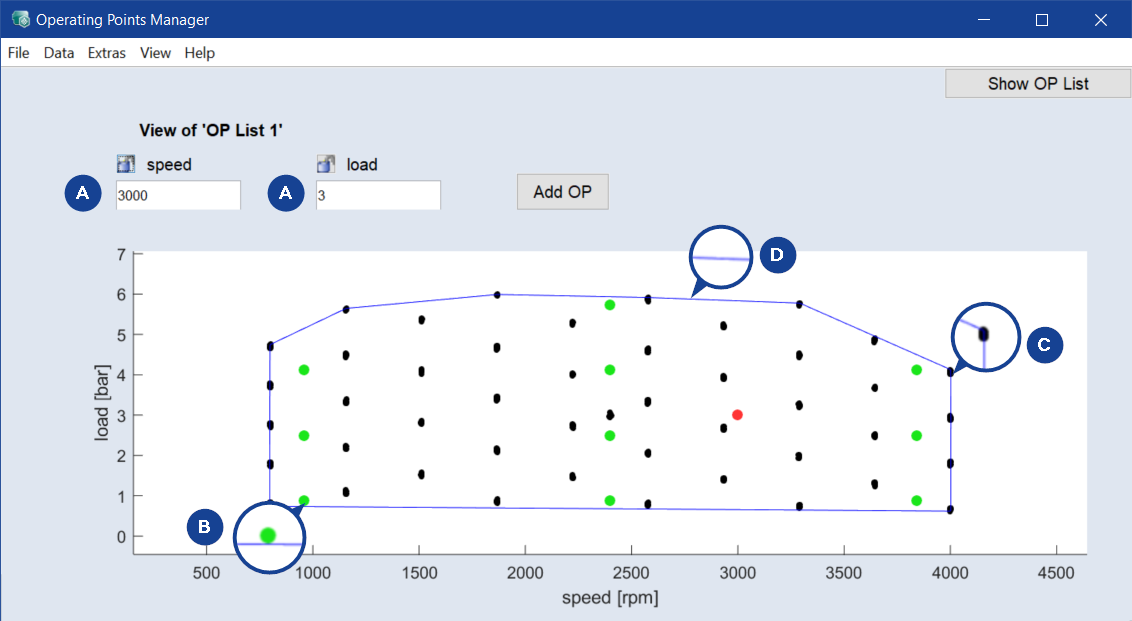
Fig. 1: Operating points manager (A: input fields for operating point values, B: operating points, C: measurement points, D: convex hull of the plot)
3D display of the influence of input variables on an output variable
An additional option concerning the graphical display consists of visualizing the influence of two inputs on a modeled output.
-
Select In/Outputs > 3D Plot Outputs.
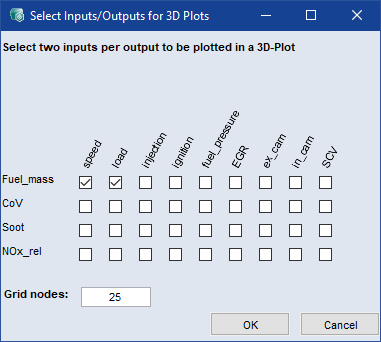
A dialog window for the selection of inputs (two per output) opens.
-
Activate, for example, speed and load for the Fuel_mass output.
-
In the Grid nodes field, enter the number of grid nodes per axis.
-
Click OK.
The 3D view of the model of Fuel_mass across the speed/load range is displayed.
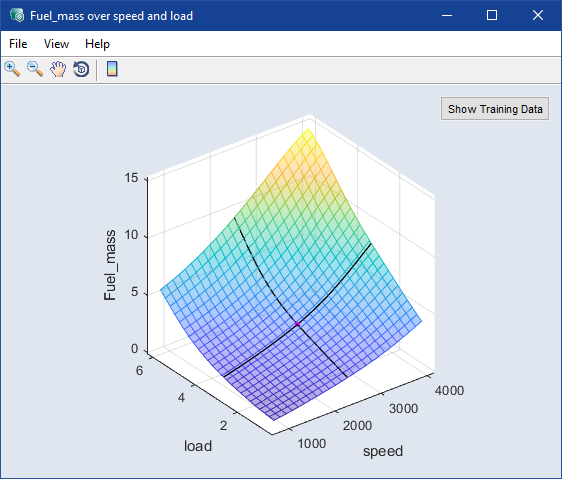
The intersection of the black lines represents the current values of the inputs, but they cannot be changed in the plot.
In case of changes of the displayed input variables in the ISP view, the position of the point in the plot is being updated.
-
In the toolbar of the 3D view, click Insert Colorbar
 .
. -
Click Show Training Data to display the training data.
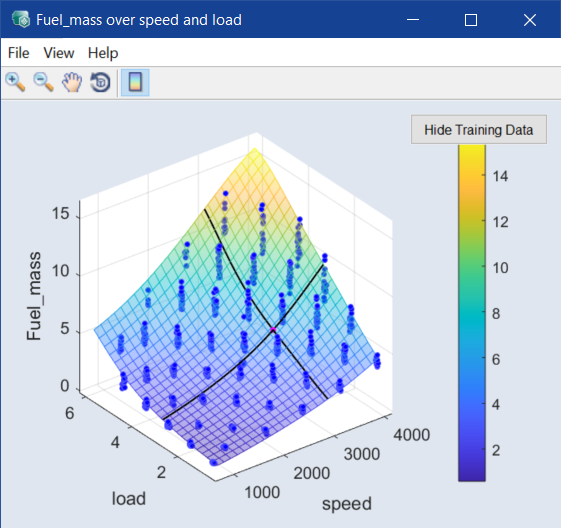
Fig. 2: 3D plot of Fuel_mass over speed and load, with training data (blue dots) and color bar
-
Select View > Show Training Data Bounds to display upper and lower limit of the training data.
Rotating and flipping the 3D plot
-
To rotate and/or flip the plot, click Rotate 3D
 .
. The mouse pointer changes into a circular arrow.
After a brief delay, the plot can be rotated into any direction and flipped while holding the left mouse button pressed.
-
To end the rotation mode, click again Rotate 3D.
Show 3D-Plot with contour lines and legend
If desired, you can add contour lines to the 3D plot. Contours are also available for calibration maps and result maps; see Calibration for more information.
-
In the 3D-Plot, select View > Contour Mode.
Contour lines are added to the plot. The plot is rotated so that you see onto the speed-load plane.
-
Rotate the plot to the position you need.
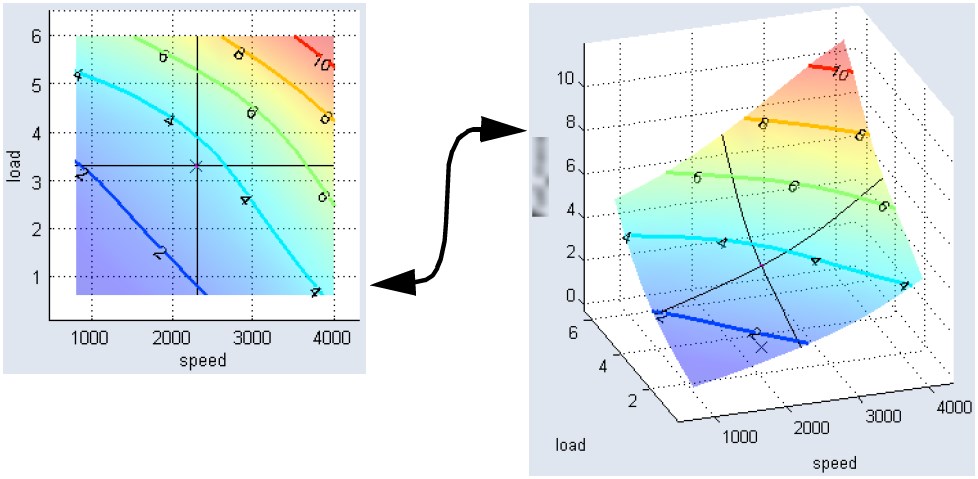
Fig. 3: 3D plot of Fuel_mass over speed and load, with contour lines
-
Use the View > Contour Options > * menu options to set up the contour mode.
Details are given in the online help.
The View > Contour * commands are also available for calibration maps and result maps; see Calibration for more information.