Signal Trace View
Extras menu > Signal Trace Modeling > Open Viewer
The Signal Trace Modeling feature allows the modeling of signal traces such as cylinder pressure curves. By connection to the ASCMO-STATIC model the effects of different combinations of input parameters to the signal trace can be visualized and analyzed.
Process of the Signal Trace Modeling
The following steps must be performed to generate a model:
- Import Training Data and Test Data (File > Import Data > *)
- Import a reference trace (File > Import > Import Reference Trace)
- Start Signal Trace Training (Model > Start Model Training)
- Model Error (Model > Model Error > *)
- Model Evaluation (Model > Evaluation List > *)
- Export Data (File > Export Data > *)
Requirements for the Measurement Data
For reading the data inASCMO-STATIC, a file with the following characteristics is required:
- File format:
- Microsoft Excel (*.xlsx/*.xls) or
- Text file with Comma Separated Values (*.csv/*.txt)
- A line must consist of the inputs and the signal trace.
- The columns of the signal trace must be contiguous.
- Columns with values that do not belong to the signal trace will be used for the modeling within ASCMO-STATIC. The model can be greatly distorted with incorrectly positioned columns. The trained model then loses its meaningfulness. Check the arrangement of the training data before importing.
- Names (and poss. units) must be located in the first line (or first and second line).
Blank lines can be processed by ASCMO-STATIC and do not have to be removed; in addition, individual values of a column can be deleted (it is not necessary to remove the entire line).
Set Current Trace as Reference
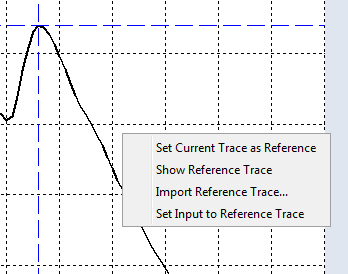
The Signal Trace View window enables you to set the current trace as reference. You have to right-click in the curve and select Set Current Trace as Reference.
If you now change the input parameters in the ISP view, you can see the reference trace with the blue color.
If you want to change the reference trace, at first you have to change the input parameters for the new reference trace and then right-click in the curve and set the current trace as reference again. So the old reference trace will be deleted.
If you have more trace outputs you can set the reference trace for all at once via View > Set All Traces as Reference.
Show Reference Trace
|
Note |
|---|
|
This function is only available if you have already set a reference trace (see Set Current Trace as Reference). |
After setting a trace reference you can visualize or not the trace reference by right-clicking in the curve again and selecting Show Reference Trace.
You can visualize all available reference traces at once via View > Show Reference Traces.
Reference trace signals can also be imported (*.xls, *.csv). You have to select File > Import Data > Import Reference Trace or right-click in the curve and select Import Reference Trace.
After selecting the file, the Signal - Import Reference Trace window opens.
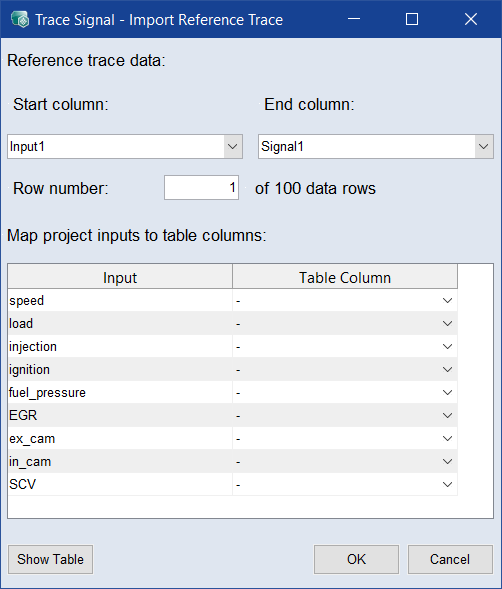
Select the Start/End column like in the Data Import and then choose the row number to identify the desired reference trace.
If available you can also provide corresponding input values for the trace to be imported by mapping respective table columns to each input of the current project.
Set Input to Reference Trace
|
Note |
|---|
|
This function is only available if you have set a reference trace AND its corresponding input values. This is the case if you either have supplied inputs when importing a reference trace or used the Set Current Trace as Reference function. |
You can set current input values of the intersection plot in the main window to that of the stored reference trace by right-clicking in the curve and selecting Set Input to Reference Trace.
Note, to conveniently display current input values in the signal trace main window you can switch on View > Show Current Input.
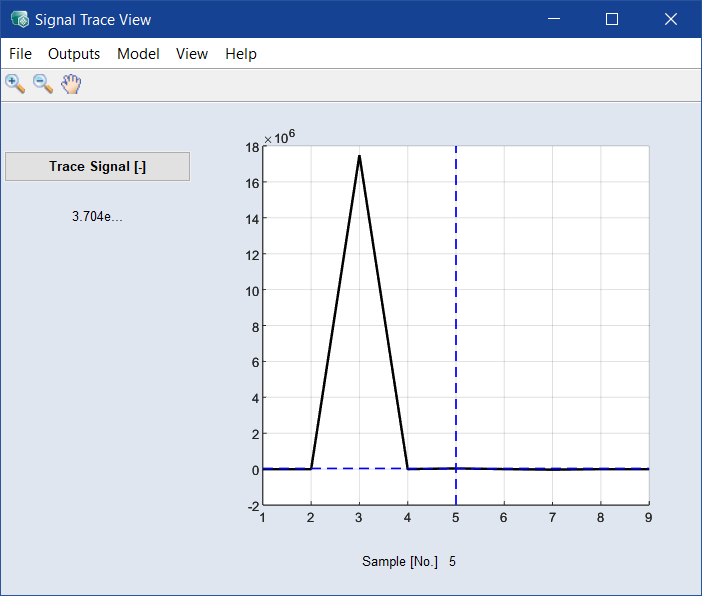
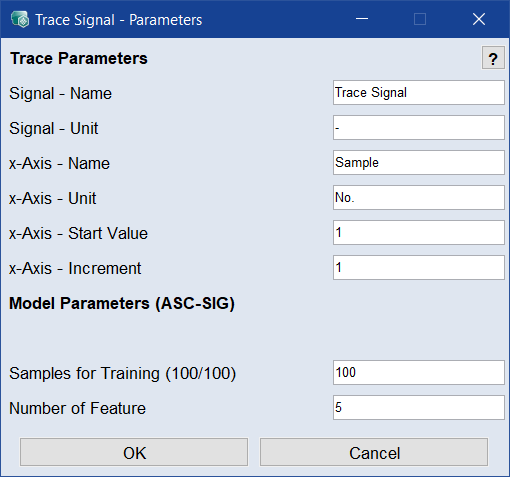
If you want to change the signal parameters, you have to click on the Trace Signal button on the left side of the Signal Trace View window. The following window opens:
 Show the
 Allows selecting the outputs to be included in the model training and evaluation, etc.
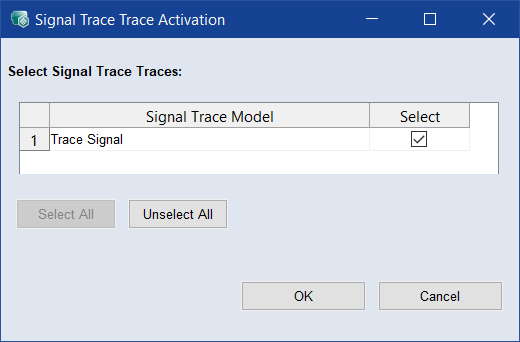
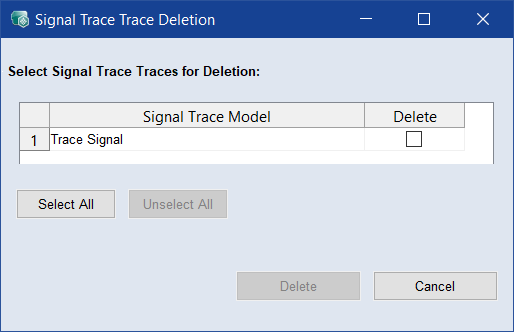
This is where outputs can be selected for deletion.
|
Note |
|---|
|
A deleted model cannot be restored. |