Optimize Grid
Optimization step >  > Optimize Grid
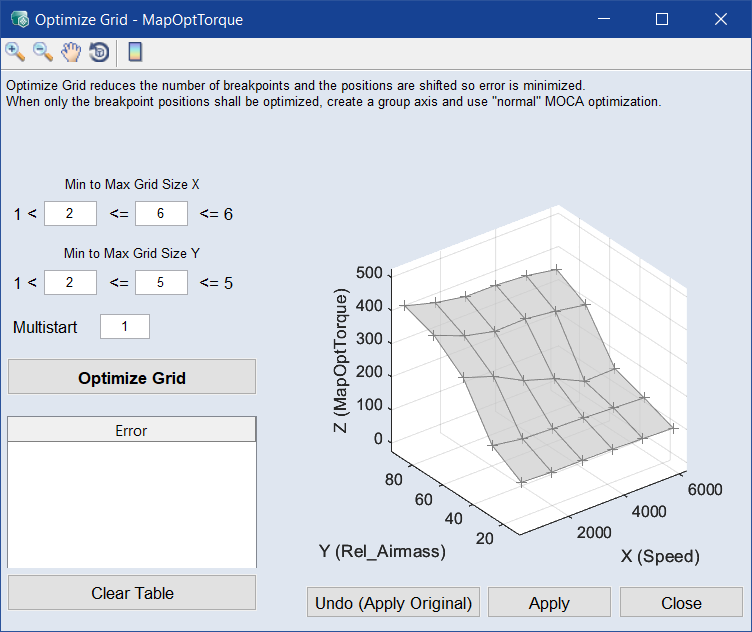
The Optimize Grid window contains the following elements.
Toolbar

|
Zoom In | Clicking in the plot will enlarge the plot representation. |

|
Zoom Out | Clicking in the plot will reduce the plot representation. |

|
Pan | Thus, the plot can be shifted within the window. |

|
Rotate 3D | Thus the 3D plot can be rotated in all three spatial directions. |

|
Insert Colorbar | Displays the current color table with the axis scaling. |
"Min to Max Grid Size X" and "Min to Max Grid Size Y"
|
Note |
|---|
|
The Min to Max Grid Size Y area is only available for maps. |
Used to enter the minima (x_min, y_min) and maxima (x_max, y_max) number of grid points for the X and Y axes.
During optimization, several maps/curves are computed.
|
curve |
x_min / x_min+1 / .. / x_max |
|
map |
x_min,y_min / x_min,y_min+1 / ... / x_min,y_max / x_min+1,y_min / x_min+1,y_min+1 / ... / x_max,y_max |
Multistart
Number of repetitions for the calculation of each map/curve.
 Optimize Grid
Starts map/curve optimization.
Optimization table
Shows the optimization results.
|
Grid |
grid size |
|
Error |
Error as L2 norm: Square root of the integral of the measured squared errors. sigma of the computed map/curve |
Clear Table
Empties the optimization table.
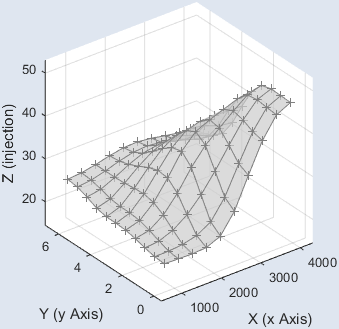
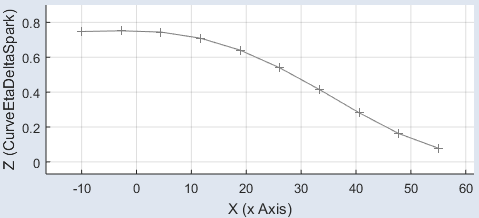
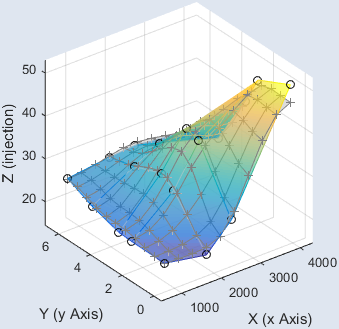
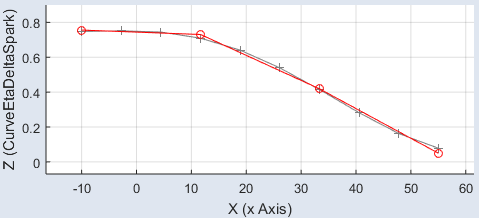
Plot area
Shows the  original map/curve and the calculated map/curve selected in the optimization table.
Undo (Apply Original)
Restores the original parameter.
Apply
Applies the map/curve version selected in the optimization table to the parameter.
Close
Closes the Optimize Grid window.
See also