Model Screening
Extras menu > Model Screening
In this window, you can perform a model analysis in three ways:
- with manual specification of the input values (Define Input Points as Grid tab)
- with values read from a file (Import Input Points from File tab)
- with values read from a calibration map (Use Inputs from Maps tab)
|
Note |
|---|
|
The calculated model outputs can then be exported to a file (File > Exports Results). |
The Model Screening window contains the following menus:
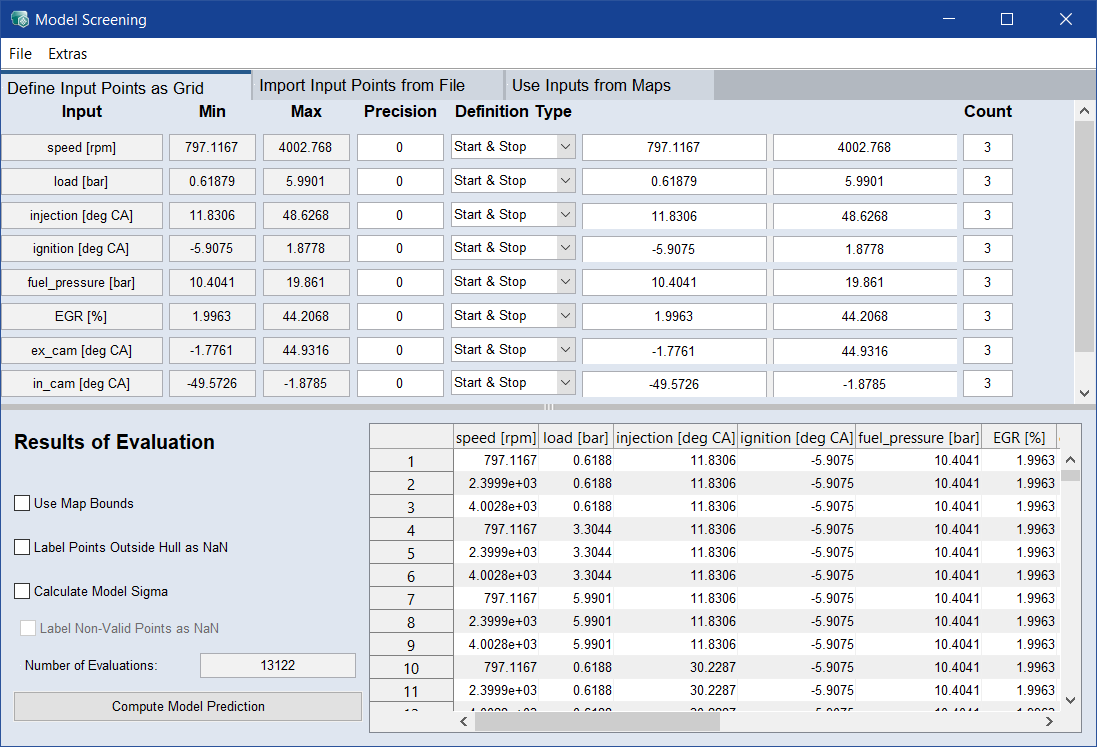
 Define Input Points as Grid
Results of Evaluation

Import Input Points from File
 button to select the input list in Excel (
Use Inputs from Maps
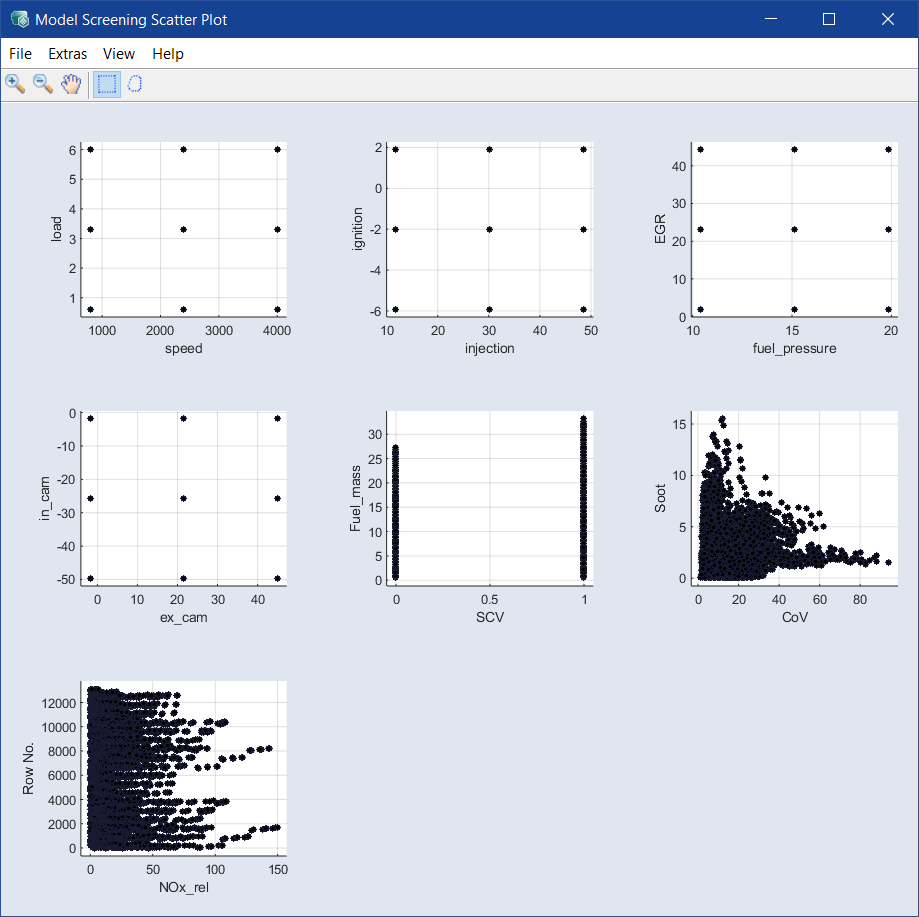
Scatter Plots for Model Screening
If you have loaded and selected a driving cycle in the Use Inputs from Maps tab, you can plot time versus Row No. in the scatter plots for model screening.
|
Note |
|---|
|
The Time axis is only displayed if you have selected only one driving cycle and nothing else. |
You can draw a rectangle around a portion of the plot and move it along the line.
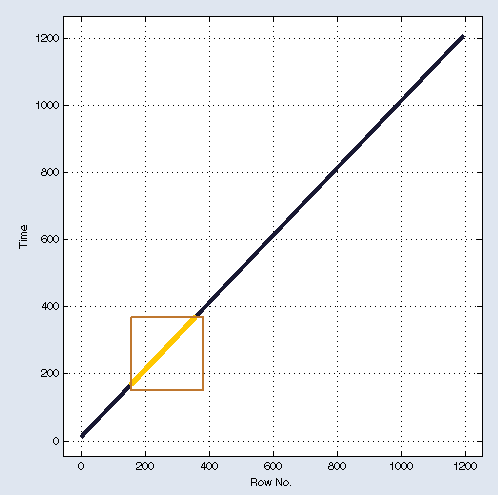
With that, you can visualize the chronological order of the points in the speed/load axes.