Input Sweep on Grid
Extras menu > Input Sweep on Grid
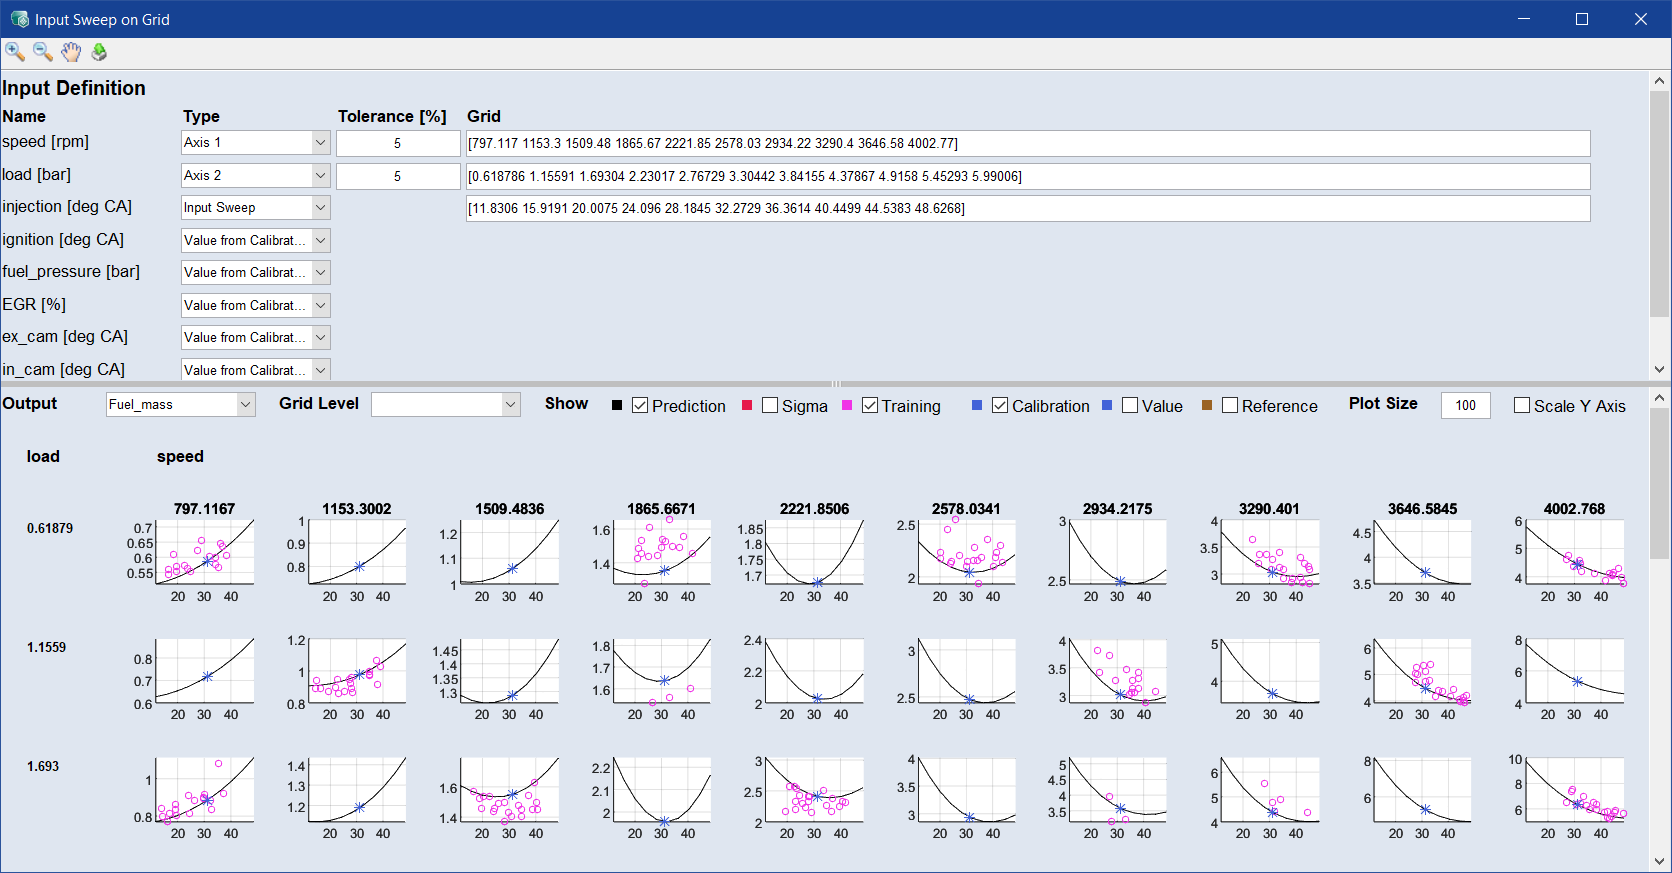
With the Input Sweep on Grid feature you get a visual representation of how a model behaves depending on an input. You can compare the working and reference calibration directly, as well as the prediction and training data.
The Input Sweep on Grid window (Extras > Input Sweep on Grid) contains the following elements:
 Input Definition
For all inputs listed under "Name" you can define the following:
"Type" drop-down
Select a type for the corresponding input. Available options are Axis 1, Axis 2, Grid, Value from Calibration Map and Input Sweep.
"Tolerance [%]" input field
Enter the tolerance in percentage for the types Axis 1, Axis 2 and Grid,
"Grid" input field
Enter or edit the grid for the types Axis 1, Axis 2, Grid and Input Sweep.
Graphs area
A plot is displayed for each combination of inputs defined as axis 1 and as axis 2. The defined grid of the input with the type Axis 1 is displayed ascending from left to right. The defined grid of the input with the type Axis 2 is displayed ascending from top to bottom.
The x-axis of each plot is the input defined as Input Sweep.
The y-axis of each plot is the output selected in the "Output" drop-down.
"Output" drop-down
Select the output you want to be included in the plots as y-axis.
"Grid Level" drop-down
Select which grid level of the input with the type Grid should be displayed in the plots.
"Show" area
Prediction: Activate the checkbox to show the prediction of the model as black line in the plots.
Training: Activate the checkbox to show the training data as blue line in the plots. The training data points are displayed, which are located on Axis 1 and 2 with a 5% deviation. If no line is displayed, no data was found.
Working: Activate the checkbox to show the working page as red asterisk in the plots.
Reference: Activate the checkbox to show the reference page as red asterisk in the plots.
"Plot Size" input field
Enter a value as the minimum height and width for the plots in pixels.
"Scale Y-Axis" checkbox
Activate the checkbox to scale the y-axes of all plots to the same range.