Normalized Parameter Sensitivity
Analysis menu > Parameter Sensitivity
The Normalized Parameter Sensitivity window contains the following elements:
Toolbar
|
|
Zoom In |
Clicking in the plot will enlarge the plot representation. |
|
|
Zoom Out |
Clicking in the plot will reduce the plot representation. |
|
|
Pan |
Thus, the plot can be shifted within the window. |
|
|
Update content of figure |
Updates the plot. |
|
|
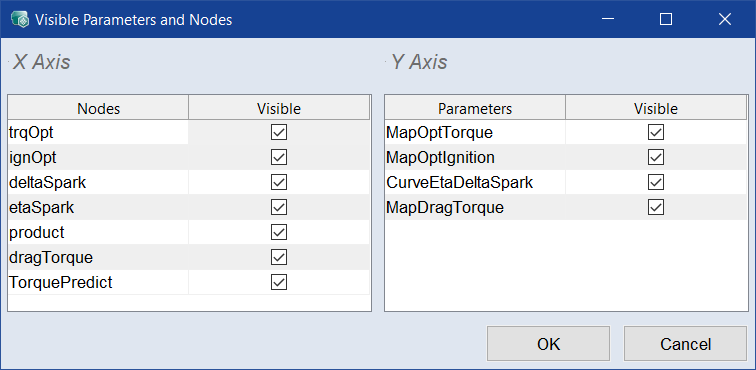
Configure displayed items |
Opens the |


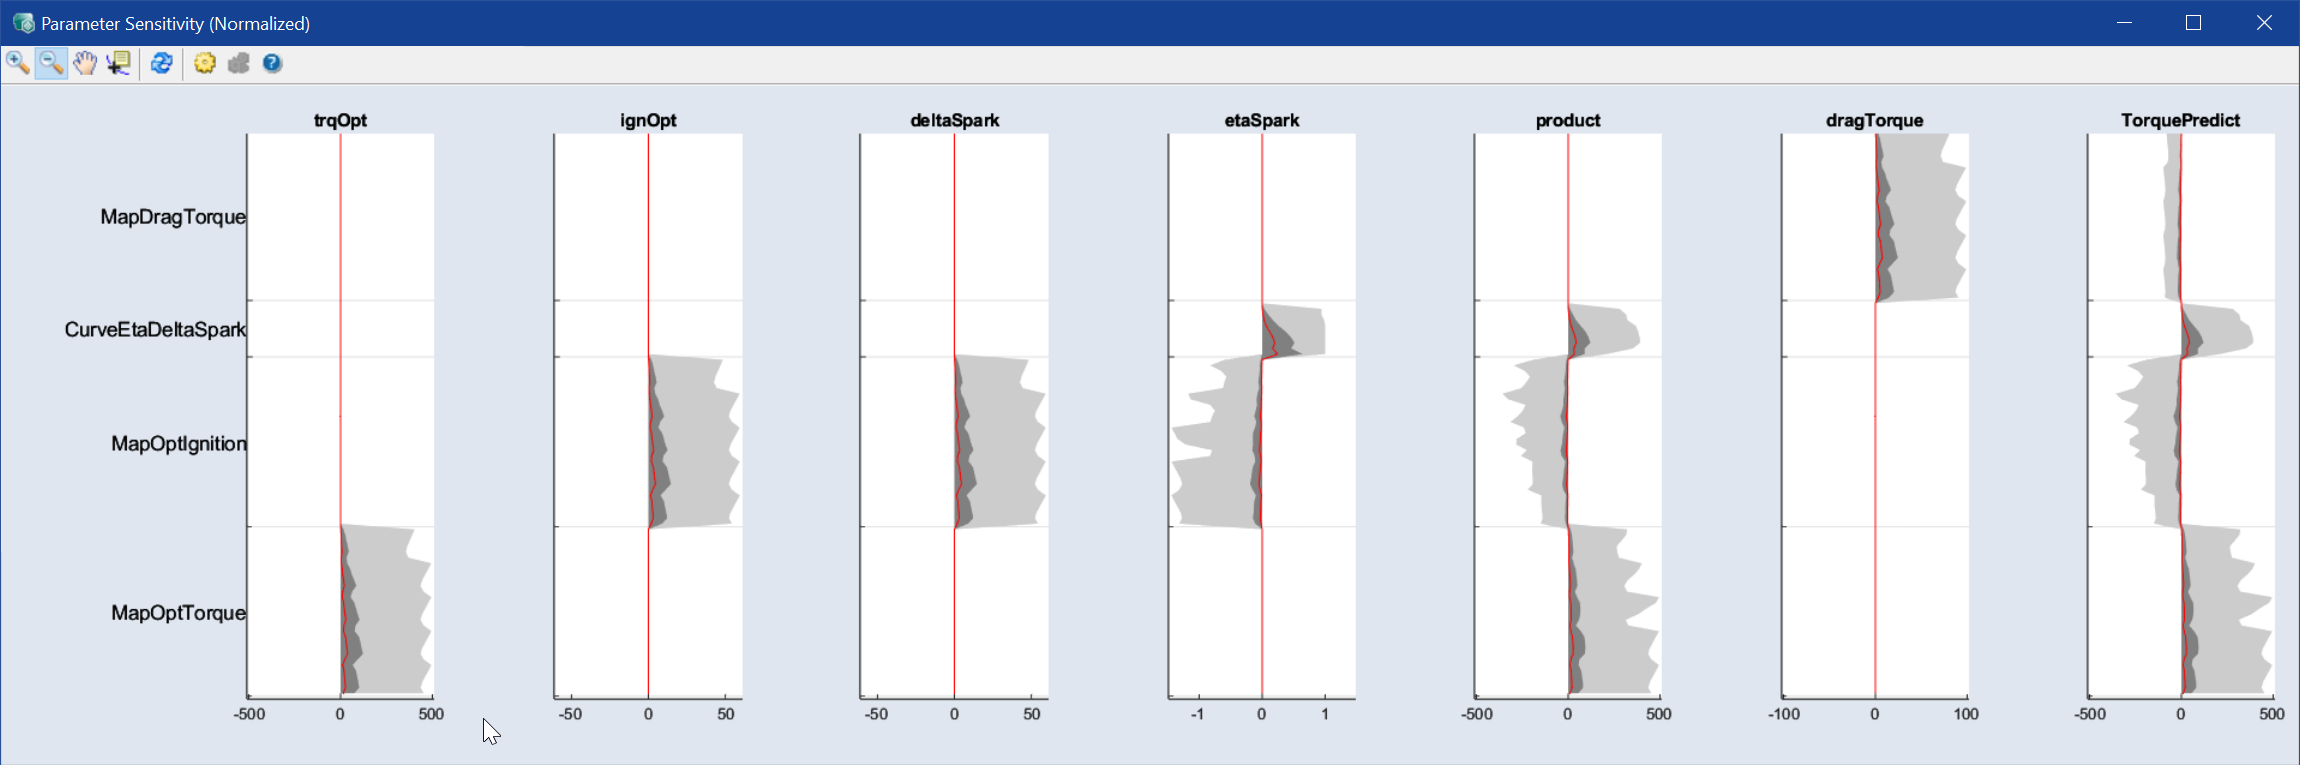
Plot area
This area shows normalized parameter sensitivity.
By default, all nodes are shown on the X axis, and all parameters are shown on the Y axis. A right-click on a parameter or node name removes that parameter/node from its axis. A (left-)click on a parameter/node name removes the other parameters/nodes from their axis. Right- or left-clicking the last parameter/node name on an axis displays all parameters/nodes.
The colors of the plots are used as follows:
-
dark gray area
maximum gradient regarding one parameter pj over all training data points
-
red line
mean gradient regarding one parameter pj over all training data points
-
light gray area
mean gradient ± 1 σ regarding one parameter pj over all training data points
Note
Smaller absolute values indicate less influence of the parameters on a node.
See also