Phasor Diagram
A phasor diagram is used to visualize and analyze AC (alternating current) quantities such as voltage, current, and phase angle. It displays these quantities as phasors, i.e. rotating vectors that represent waveforms in a simplified, static form.
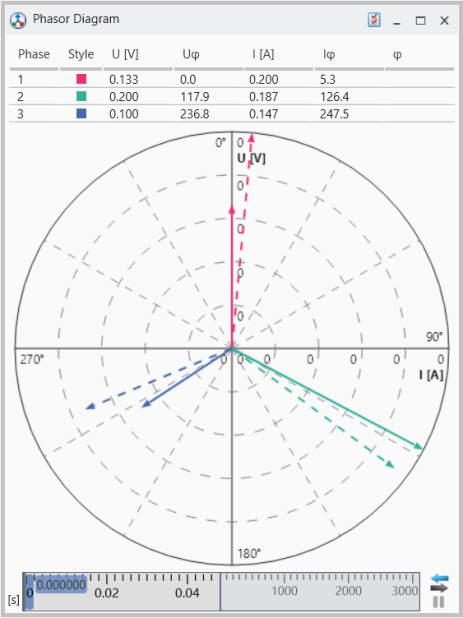
It helps to easily see the magnitudes of the assigned signals and the differences between the phases. The different phases are indicated in predefined colors such as red, green, and blue.
The voltage phasors are represented as solid lines, while the current phasors are shown by dashed lines. The length of a phasor represents the amplitude of the voltage or current signal. The angle between the voltage and the current phasor represents the phase shift between both quantities in each phase.
You can perform the following actions:
- To add signals
- To replace signals
- To remove signals
- To move or copy signals
- To assign signals to a new instrument
- To edit the visible range
- Drag and drop each of the input signals individually into the table above the diagram.
- Ensure that the signals are assigned correctly in view of physical quantities and phases.
To replace an already assigned signal
- drag and drop another one into the cell in the table.
Signals can only be removed via the Configuration Manager.
- Expand the view for the respective phasor diagram to see the assigned signals.
- Select the signal(s) to be deleted and remove these by means of the entry in the context menu.
To move or copy a signal from the Phasor Diagram Instrument to another Instrument,
-
Select the signal from which you want to move or copy the signals to another instrument.
- Do one of the following:
To move or copy signals from one instrument to another instrument.
- To copy the signals press the Ctrl key first before dropping the selected signals onto another instrument.
The same operations are also supported in the Configuration Manager.
If the target instrument is located on another layer, use the layer tabs to navigate to the desired layer.
To create a new instrument, drag and drop the selected signals onto an empty space of the layer or onto the layer tab.
When you move or copy a signal, MDA checks whether the target instrument supports the current data representation. If this is not the case, the physical data representation is used instead.
To assign signals to a new instrument
 Selecting Signals.
Change the Maximum Visible Voltage and Maximum Visible Current value in the Properties window. The edited values are then reflected in the corresponding graphical scale.
Two options are available for the visible range in the Properties window:
|
Value Name |
Value Definition |
|---|---|
|
Maximum Visible Voltage |
Maximum visible voltage which will be displayed. |
|
Maximum Visible Current |
Maximum visible current which will be displayed. |