Bar Chart Instruments
For evaluating and comparing several similar signals for one point in time, such as the cell voltages of an electric vehicle battery system.
The display can be customized to the specific physical quantities (such as voltages, temperatures, pressures, etc.) using the settings in the instrument properties.
Using the bar chart instruments, you have the following options:
-
To get a graphical overview of all signal values of the individual signals.
The overview can be based on the absolute signal values (Absolute Value Bar Chart) or the deviations from the mean (Delta Bar Chart). -
A sortable tabular overview (sortable list) so that you can easily identify the signals with the highest or lowest values or deviations.
-
A classification of the signals into groups with comparable signal values (Signal Distribution List).
-
User-definable additional signals
-
Per drag and drop other relevant signals can be added to the summary area. In the Properties window the displayed name, the decimals and the unit can be adapted. Additionally, added signals can be removed from the summary area in the Configuration Manager.
-
All bar chart instruments always show values for one specific point in time.
All bar chart instruments support instrument synchronization possibilities of MDA.
|
Note |
|---|
|
A signal can only be assigned once to each bar chart instruments. |
The bar chart instruments contain the following:
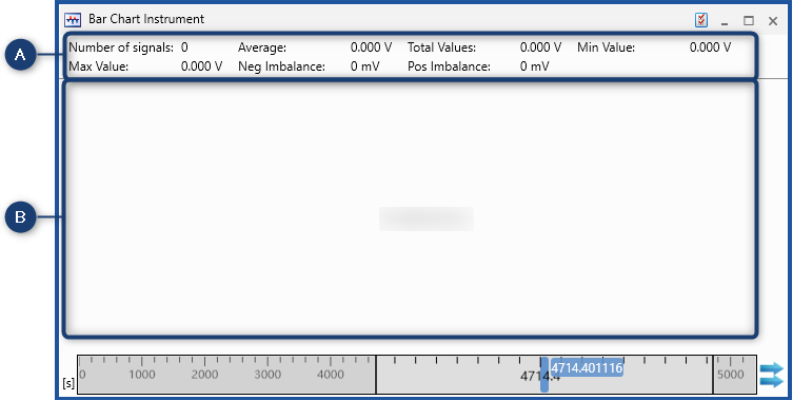
|
No. |
Description |
|---|---|

|
Summary Area |

|
Specific instrument view |
Summary Area
In the Properties window you can customize the summary area and define and define the following items.
By default, the Summary Area shows the following information:
Number of Signals
Displays the number of signals assigned to the instrument.
Average
Displays the average value of all signals assigned to the instrument.
Total
Displays the total value of all signals assigned to the instrument.
Minimum
Displays the minimum value of all signals assigned to the instrument.
Maximum
Displays the maximum value of all signals assigned to the instrument.
Negative Deviation
Displays the highest negative deviation from the average value of all signals assigned to the instrument.
Positive Deviation
Displays the highest positive deviation from the average value of all signals assigned to the instrument.
In the Properties window you can customize the summary area and define which of the entries listed above you want to see and, if desired, rename it accordingly.
-
Additional signals can be assigned to the summary area of a bar chart instrument via the function "Drag and drop".
-
The displayed name of the new entry can be defined in the instrument properties.
-
Both recorded as well as calculated signals can be assigned.
-
The entry can be moved in the Configuration Manager.
See also