Using Cursors
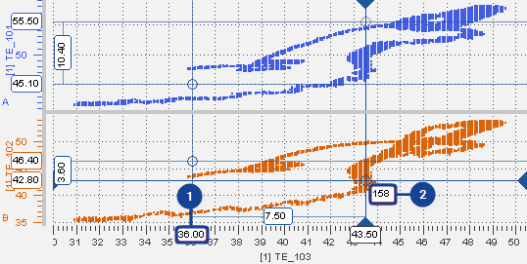
In the scatter plot, two values of the signal are marked by cursors. The cross-hair indicates the exact position of each cursor. If several strips exist, two horizontal lines per strip are displayed.
|
No. |
Description |
|---|---|
|
|
Tooltip at the value axis displaying the signal value |
|
|
Tooltip at the cross-hair of the cursors displaying the time stamp |


 Using the Scatter Plot.
-
To show the cursors, click
 .
.Alternatively, press Ctrl+R.
As in the oscilloscope first one cursor is created, another click will create a second cursor.
-
If you want to move a cursor to another sample, hover on one of the cross-hairs and drag it to the new position.
Alternatively, press the following keys:
- To switch between the cursors, press Alt+Arrow Left/ Alt+Arrow Right.
- To change the cursor position, press Arrow Left/ Arrow Right/ Arrow Up/ Arrow Down.
- When clicking the cursor icon again, this has the following effect:
- If both cursors have been in the visible area, they are hidden now.
- If one of the cursors has been outside the visible area, it is displayed now.
Note
If instrument synchronisation is active, always one cursor must remain.
If the instrument synchronization is active, also the cursors will be synchronized. The currently active instrument defines how many cursors will be shown. A cursor movement in the active instrument causes a cursor movement in the synchronized instruments. However, a cursor in the scatter plot will move only, if for the time defined by the cursor position another sample is available in the scatter plot.