Oscilloscope
The oscilloscope can graphically display the course of signals over time.
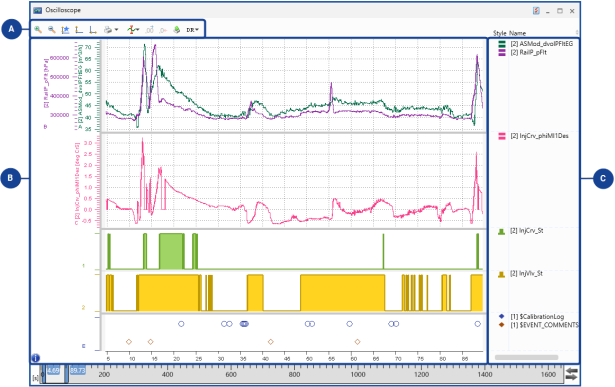
The oscilloscope is divided into the following areas:
|
No. |
Description |
|---|---|
|
|
Toolbar Here several icons for specific functionalities are shown. For a detailed description of the toolbar functions, see Oscilloscope's Toolbar. |
|
|
Strip area The signals in the oscilloscope can be distributed onto strips for a better overview. For more information, see Using Strips. |
|
|
Signal list The signal list shows the signal information and cursor values. For more information, see Adjusting the Signal List. |


See also