Phasor Diagram
A phasor diagram is used to visualize and analyze AC (alternating current) quantities such as voltage, current, and phase angle. It displays these quantities as phasors, i.e. rotating vectors that represent waveforms in a simplified, static form.
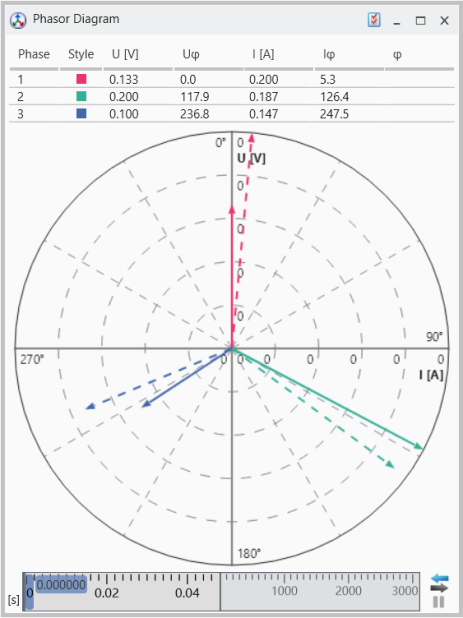
It helps to easily see the magnitudes of the assigned signals and the differences between the phases. The different phases are indicated in predefined colors such as red, green, and blue.
The voltage phasors are represented as solid lines, while the current phasors are shown by dashed lines. The length of a phasor represents the amplitude of the voltage or current signal. The angle between the voltage and the current phasor represents the phase shift between both quantities in each phase.
You can perform the following actions:
- Drag and drop each of the input signals individually into the table above the diagram.
- Ensure that the signals are assigned correctly in view of physical quantities and phases.
To replace an already assigned signal
- drag and drop another one into the cell in the table.
Signals can only be removed via the Configuration Manager.
- Expand the view for the respective phasor diagram to see the assigned signals.
- Select the signal(s) to be deleted and remove these by means of the entry in the context menu.