Signal Distribution Chart
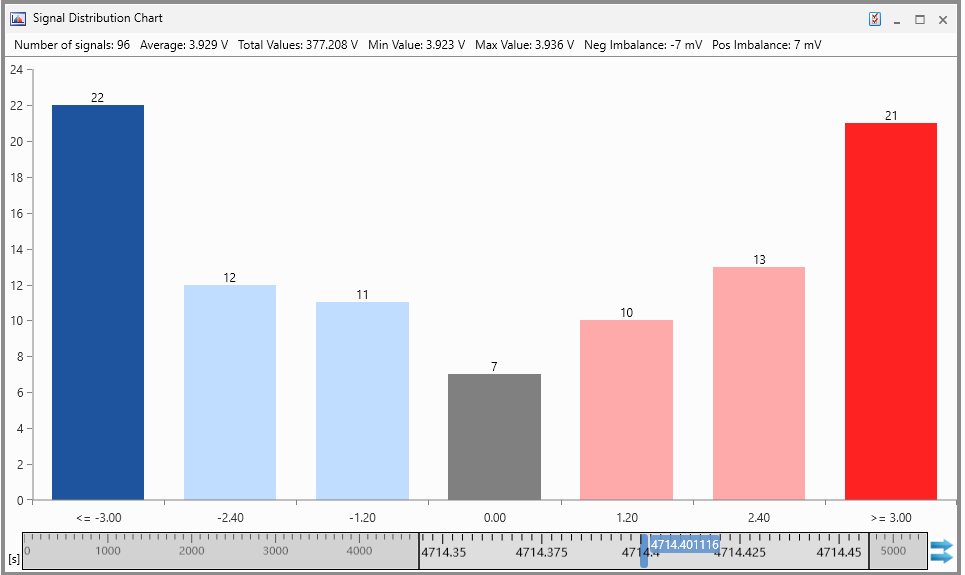
The Signal Distribution Chart is an instrument for statistical analysis. The chart is calculated based on the signal values at a given point in time. In the chart, the height of each bar represents the number of signals that fall within the defined value range of the respective bucket.
|
Bar color |
Description |
|---|---|
|
|
Signals with a value below the lowest bucket |
|
|
Signals with a negative deviation from the average |
|
|
Signals with a value around the average |
|
|
Signals with a positive deviation from the average |
|
|
Signals with a value above the highest bucket |


You can perform the following actions:
To define the Signal Distribution Chart properties
The complete set of configuration possibilities for this instrument is available in the Properties docking window. There, the tooltips provide a detailed description of the properties and their possible options.
-
Do one of the following:
-
In the instrument, click
 .
.or
-
Select the instrument and press Alt+Enter.
or
-
In the instrument, right-click and select Properties in the context menu.
-
 Selecting Signals.
To know how you can add signals to a new or existing instrument, see Assigning Signals to Instruments.
Note: Each signal can be added only once.
To define the number of buckets and their value ranges
-
Open the instrument Properties window as described above.
-
In the Number of Buckets, select the number of buckets from the drop-down menu. Only odd numbers are available.
-
In the Interval Size [mV] field, enter the value for the interval size.
-
All changes are applied immediately.
The central bucket is always aligned with the imbalance value 0. The number of buckets and the interval size define the overall value range for the histogram. The number of signals with lower or higher imbalance values are shown as additional columns in darker colors on the left and right.
To identify the signals of a bucket
Hover over the respective bucket. The tooltip displays the list of signals that fall within the value range of the bucket.
To move or copy signals from the Signal Distribution Chart to another Instrument
-
Select the bucket from which you want to move or copy the signals to another instrument.
-
Do one of the following:
-
To move or copy signals from the Signal Distribution Chart to another Instrument another instrument.
-
To copy the signals press the CTRL key first before dropping the selected signals onto another instrument.
-
-
Click the Configuration Manager window.
-
In the Signal Distribution Chart instrument select the signals that you want to delete.
-
Press Del.
See also