Phasor Diagram
This window contains the following features:
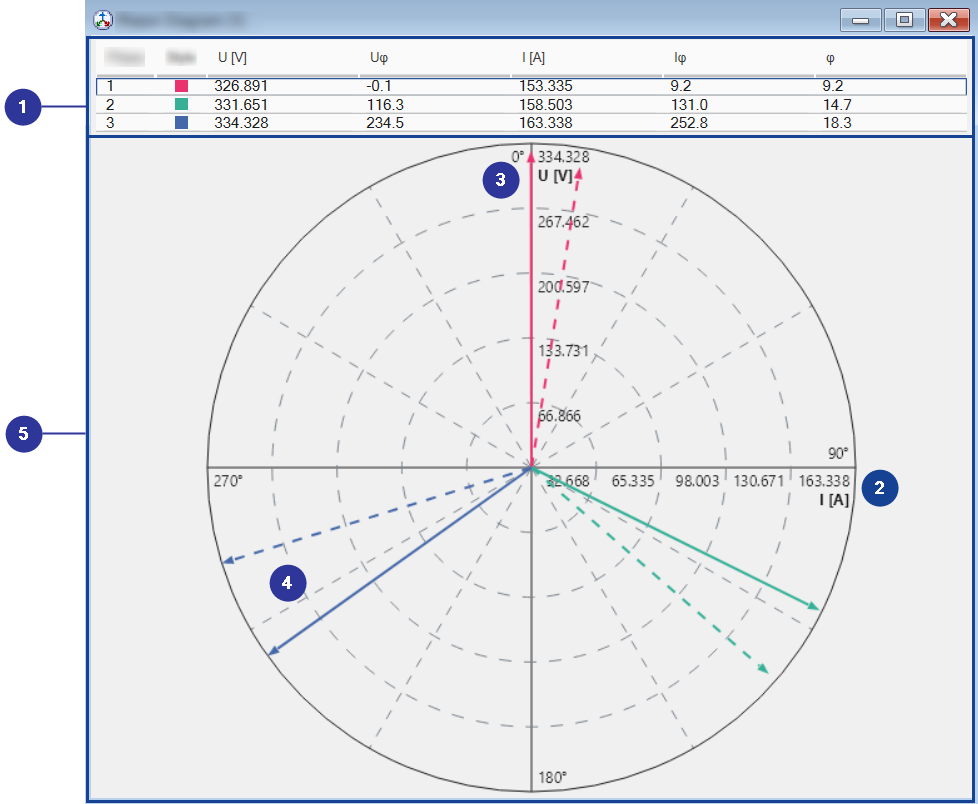
Signal list
Displays the used measure variables.
You can add, remove, copy, and move variables to other windows via the context menu of the signal list.
x-Axes
Displays the axis for the current.
y-Axes
Displays the axis for the voltage
Angle
Displays the phase shift between voltage and current
Display area
Presents voltage, current and the phase shift graphically. The voltage is represented by a solid arrow. The current is represented by a dotted arrow. The phase is the angle between voltage and current.