Experiment - New Phaser Diagram(SP 1)
The Phasor Diagram can be used to visualize and analyze AC (alternating current) quantities such as voltage, current, and phase angle.
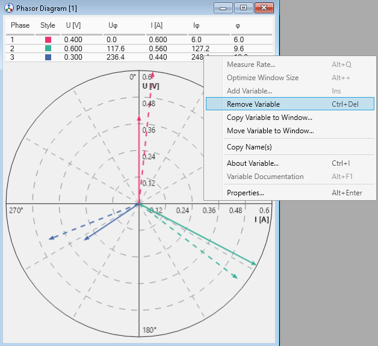
The voltage phasors are represented as solid lines, while the current phasors are shown by dashed lines. The angle between the voltage and the current phasor represents the phase shift between both quantities.
You can add a Phasor Diagram to a layer of your workspace via the Variable Selection window, by using the context menu Add Widget > Phaser Diagram.
The same Phasor Diagram as in MDA is used by INCA.
Variables can be added via the context menu of the Phaser Diagram.
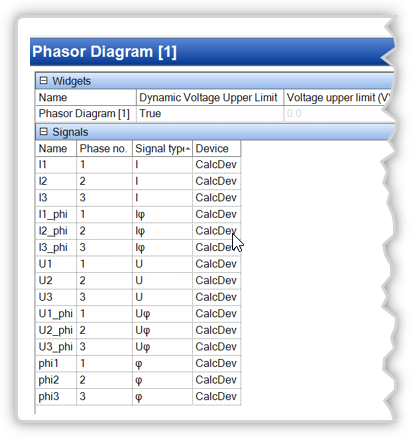
The Signal type definition is possible via the VSD Display Configuration tab.
Drag-and-drop between cells within widget and from other widgets into Phasor Diagram is also possible in the Experiment Environment.
Up to 15 signals can be added.
Back to