Getting Information about the Report
There are several options how you can get information about the complete report or parts of it:
- To get general report and measurement information
- To get signal information of all signals in the report
- To get signal information of signals used in a display object
- To get display object information
- To get threshold information
To get general report and measurement information
-
In the toolbar of the report, click
 .
. -
Do one of the following:
-
To display the general report information, select the Report Info tab.
Optionally, you can change the MDA path here. If you use the MDA export functionality, this path is used by MDA to open the exported MDA configuration. For more information, see Exporting an MDA Configuration.
- To display the measurement information, select the Measurement Info tab.
-
To get signal information of all signals in the report
- In the toolbar of the report, click .
-
Select the Signal Info tab.
You can search for specific signals and export them. For more information, see Exporting Signal Information.
To get signal information of signals used in a display object
- In the upper right corner of the display object, click
 .
. -
Select the Signal Information tab.
If the report has been created based on a merge process from several evaluations, you can select the display object for which the signal information shall be displayed. Click the drop-down menu in the upper right corner showing the selectable items, for example:
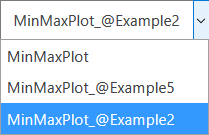
For more information about the merge modes, see Changing the Merge Mode.
To get display object information
- In the upper right corner of the display object, click .
-
Select the Chart Properties tab.
If the report has been created based on a merge process from several evaluations, you can select the display object for which the signal information shall be displayed. For more information, see step 2 in To get signal information of signals used in a display object.
- In the toolbar of the report, click .
-
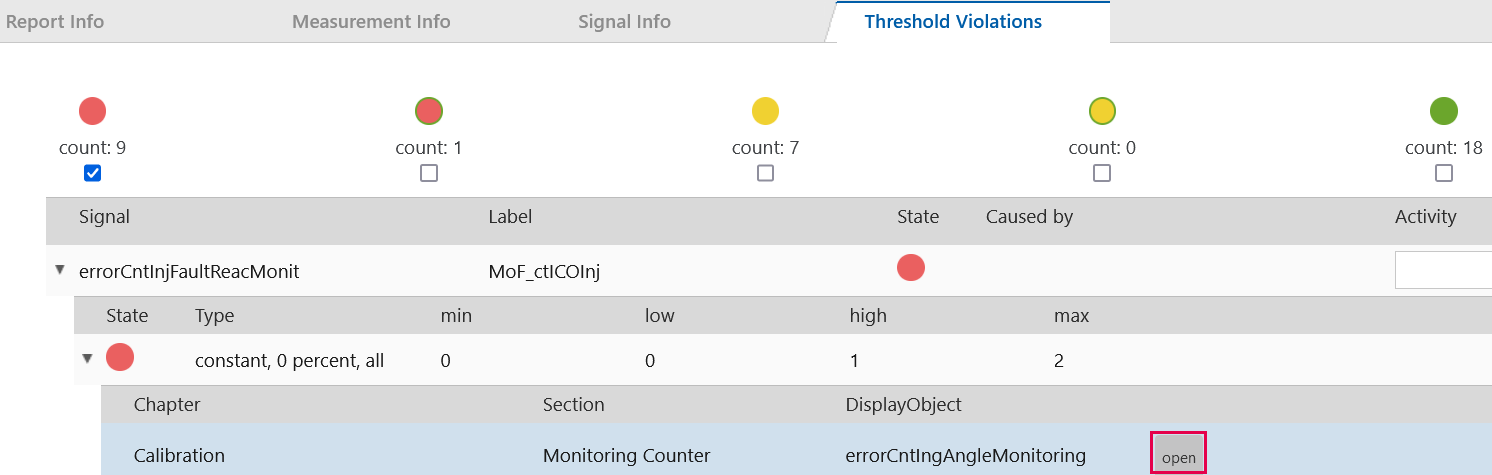
Select the Threshold Violations tab.
All detected threshold violations are shown.
-
At the top, the number of thresholds within a certain range (red, yellow, green) is displayed. You can select the thresholds of a specific range by clicking the checkbox below each range. For more information about the ranges, see Traffic Lights.
-
The tree view, shows the threshold information for each signal. Optionally, you can enter a comment for each signal in the Activity field. For example, if a traffic light is red you can describe the activities that should be undertaken to solve the problem.
Note that you can only edit this field if you have opened the report via the EATB software. If you have opened the report by opening the *.html file of the report in your browser, this option is not available.
-
If you expand the tree view, you get the detailed threshold information of this signal including the definition of the ranges and the threshold type. For more information, see Threshold Types.
-
If you further expand the tree view, the location of the threshold (chapter, section, display object) is shown.
-
If you click the Open button in this row, the dialog is closed and the display object is shown in the report.