Using the Report
In the report, the structure that you have defined before is shown on the left.
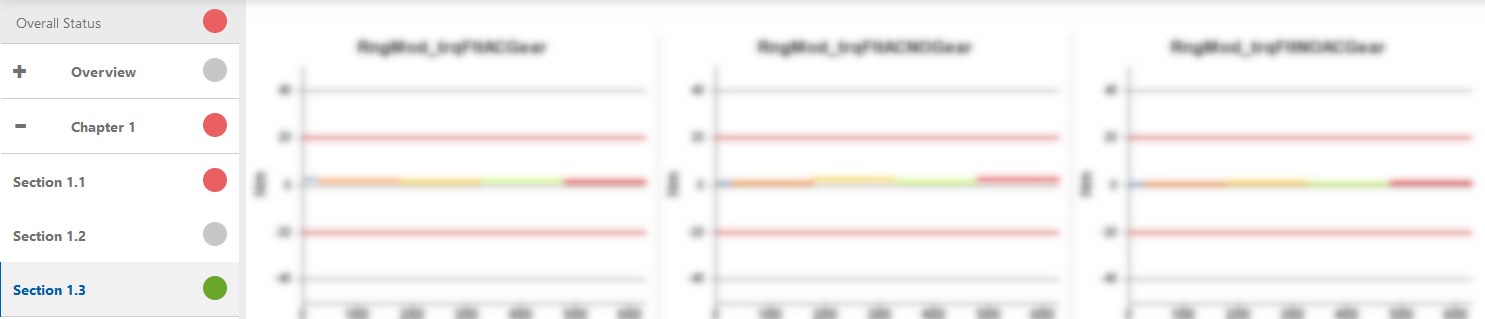
Traffic lights on all levels of the report structure indicate if a defined threshold has been violated. Based on the traffic lights of each display object, traffic lights on higher levels are calculated automatically.
The traffic light colors are defined as follows:
| Icons | Icons (new) | Description |
|---|---|---|

|
|
No thresholds were set or signals were empty. |

|
|
No threshold is violated. |

|
|
No critical threshold is violated. |
 |
|
A critical threshold is violated. |


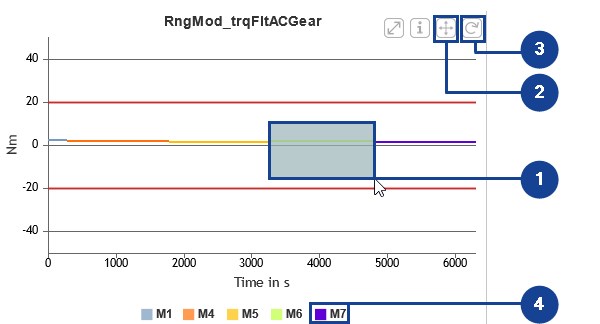
On the right, the display objects of the currently active section are displayed. Within each chart, these are the main functionalities:
-
Zooming: Keep the left mouse button pressed while moving the cursor.
-
Scrolling: To switch to the scroll mode, click
 .
. -
Showing the complete chart again: Click
 .
. -
Hiding samples: Click the corresponding name in the legend.
For more information about all report features, see EATB Report.