Scatter
Extension of the chart type plot. In addition to the classical point cloud, a third signal is used for evaluation. The third signal is integrated into the point cloud by a color map and displayed on the z axis.
For a given point according to your x and y value, multiple z values can exist. You can specify which z value should be used by defining the display type.
Display Types
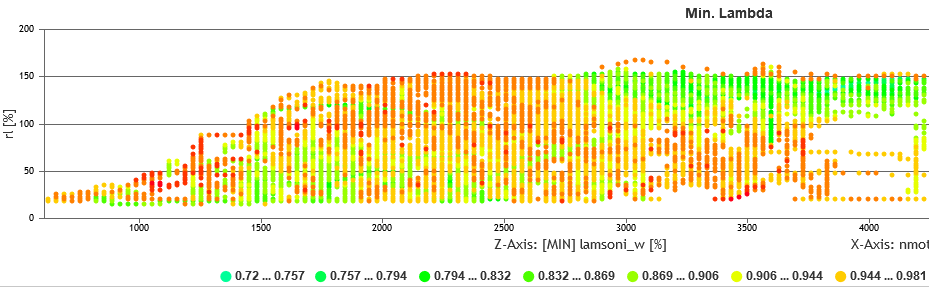
- min: Minimum of the corresponding z values
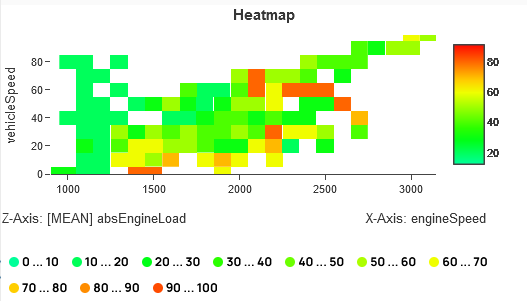
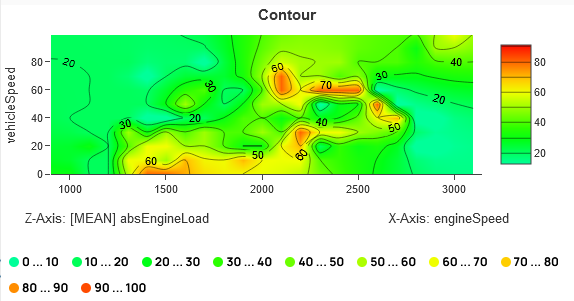
- mean: Mean value of the corresponding z values
- max (default): Maximum of the corresponding z values
- absFrequency: Absolute frequency of the corresponding z values
- relFrequency: Relative frequency of the corresponding z values
- relMeanFrequency: Mean frequency of the corresponding z values
- durationAbs: Absolute duration of all corresponding z values
-
contour:
-
heatmap: