Interval
Chart type that represents a segment of a signal whose boundaries are determined by one trigger with duration or one start and one end trigger.
Display Types
-
series:
The x axis shows the index of the samples. The y axis shows the signal values. The start index of the samples for the calculation is the last index from the last measurement + 1.
-
stack:
The x axis shows the index of the samples starting with 1. The y axis shows the signal values.
-
minX, minY, meanX, meanY, maxX, maxY:
If only one signal is set for the chart, the x axis shows the samples and the y axis shows the signal values. If two signals are set for the chart, the x axis shows the values of the first signal and the y axis shows the values of the second signal.
-
duration:
The x axis shows the signal values. The y axis shows the durations of found intervals.
If you use duration or minX, minY, meanX, meanY, maxX, maxY, you get a chart that is similar to a plot. There are two ways for displaying the data: If you specify two signals, the first one is on the x axis and the second one on the y axis. If you specify one signal, the x axis shows individual samples that belong to the individual intervals, respectively.
In the generated report, you can switch between "series" and "stack".
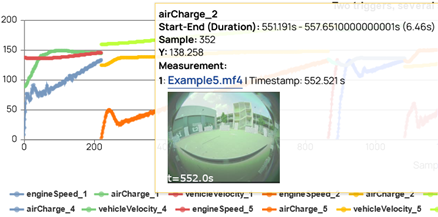
Video Support
If you have used an environmental camera during measurement recordings, the closest available video information can be shown per timestamp as a screenshot in the tooltip. If multiple videos are available multiple video streams are shown next to each other.
You can enable the video support for timeplots, intervals, and GPS maps. Note that you can only enable videos within the EATB APIs.