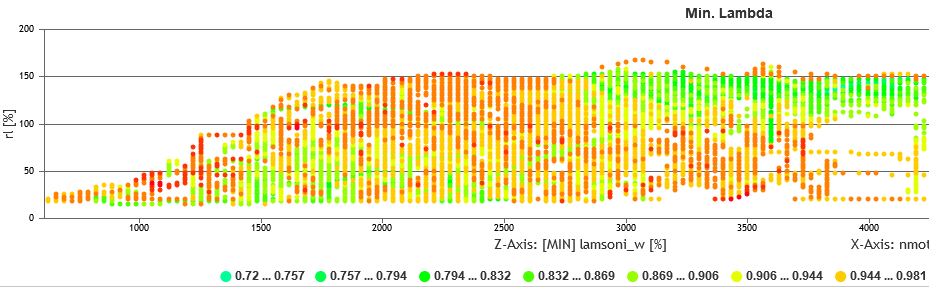
Scatter
Extension of the chart type plot. In addition to the classical point cloud, a third signal is used for evaluation. The third signal is integrated into the point cloud by a color map and displayed on the z axis. For a given point according to your x and y value, multiple z values can exist. You can specify which z value should be used in this case. For more information, see Display Types.