Plot
Chart type that represents signals in point clouds, combining two signals and displaying them in dependence. It is also possible to display several signals with different colors in one chart with an associated entry in the legend.
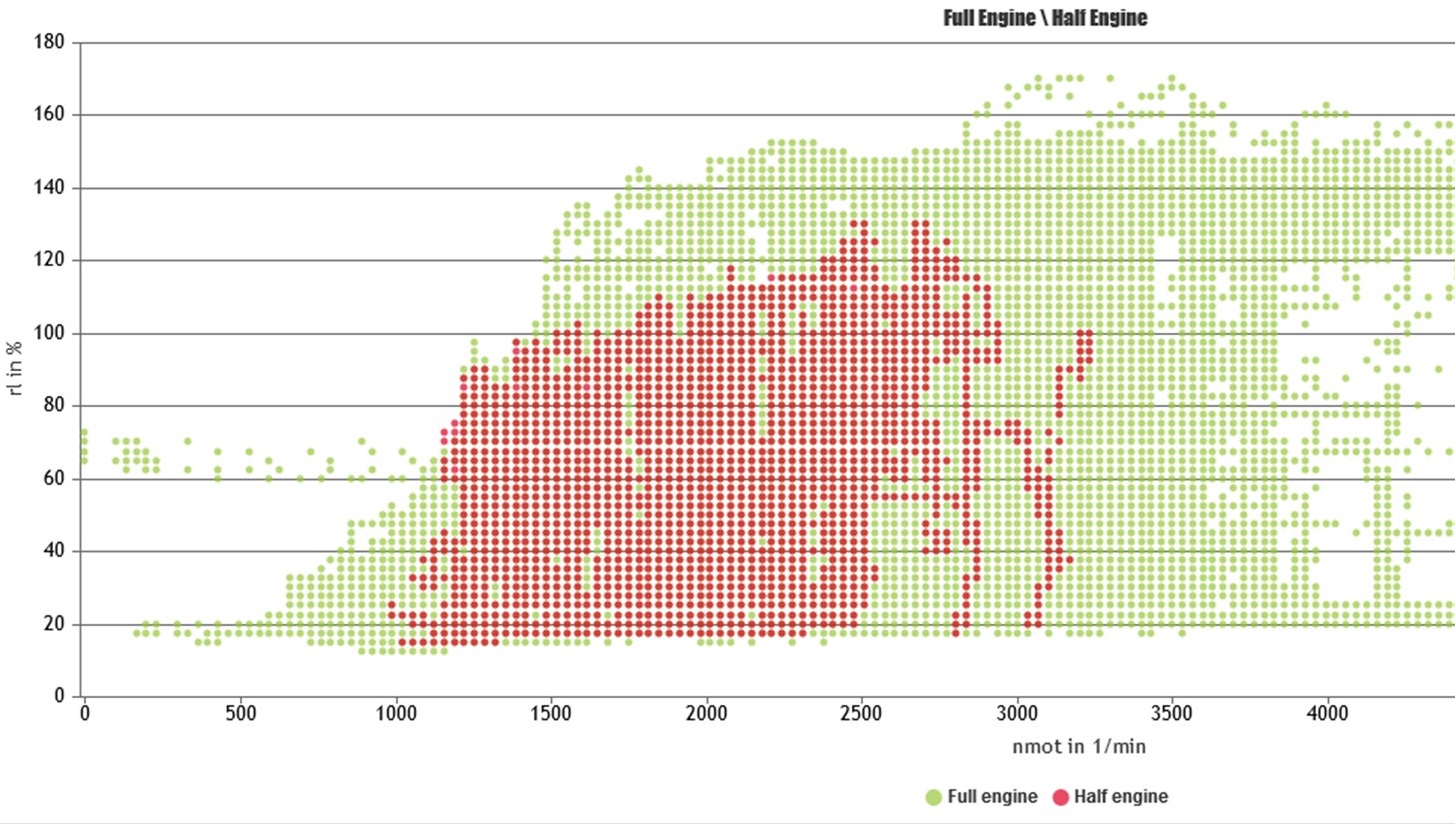
In this example, the engine speed (nmot) is shown on the x axis and the air charge (rl) on the y axis. The plot also has a child shown in red. The red points are the data points when the engine is running in half-engine mode. The green points are the data points when the engine is running in full-engine mode.