Interval
Chart type that represents a segment of a signal whose boundaries are determined by one trigger with duration or one start and one end trigger. In the following, some examples of intervals with different display types are shown. For more information, see Display Types.
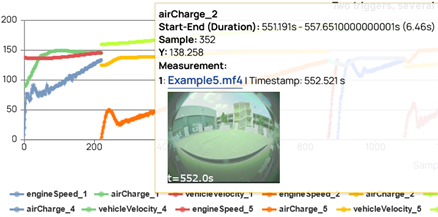
If you have used an environmental camera during measurement recordings, the closest available video information can be shown per timestamp as a screenshot in the tooltip. If multiple videos are available multiple video streams are shown next to each other.
You can enable the video support for timeplots, intervals, and GPS maps. Note that you can only enable videos within the EATB APIs.